
Figure 3. Survival curves according to multivariate Cox proportional-hazards regression analysis.
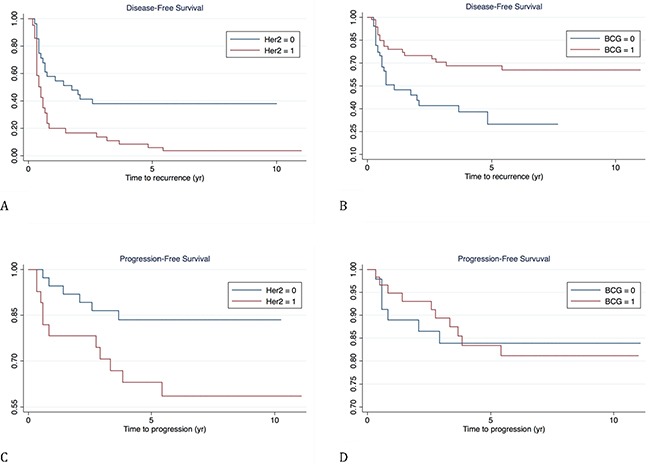
(A and C): disease-free and progression free survival according to HER-2 status; (B and D): disease-free and progression free survival according to BCG treatment.