
Figure 1. Correlation between time to first therapy (TTFT) and genetic abnormalities.
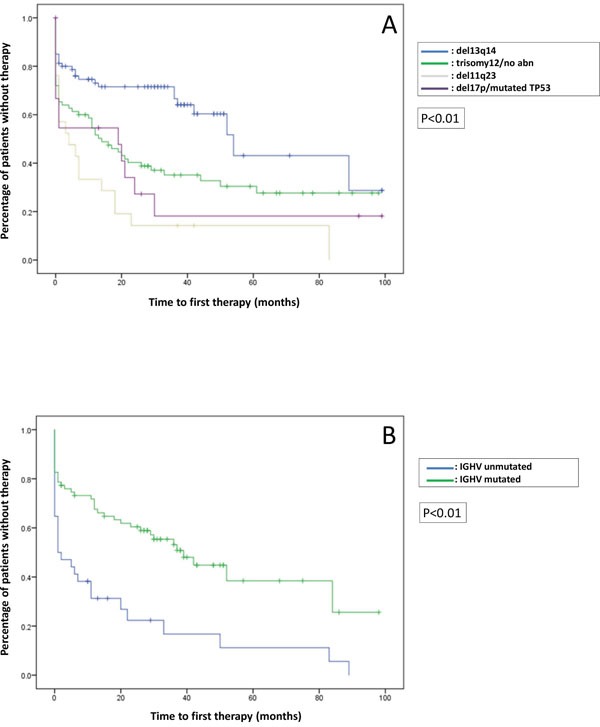
(A) TTFT stratified according to the FISH abnormlities. (B) TTFT stratified according to the IGHV mutation status.
Official websites use .gov
A
.gov website belongs to an official
government organization in the United States.
Secure .gov websites use HTTPS
A lock (
) or https:// means you've safely
connected to the .gov website. Share sensitive
information only on official, secure websites.
(A) TTFT stratified according to the FISH abnormlities. (B) TTFT stratified according to the IGHV mutation status.