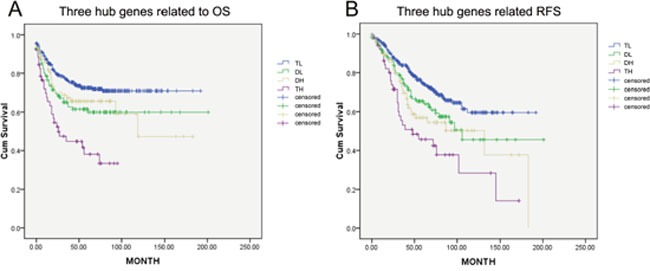
Figure 8. THBS2, INHBB and BGN were classified into four groups (TL, DL, DP and TH; cut-off value of high and low group: upper quartiles).

OS and RFS were significantly different between these groups (p<0.05). TN has the best survival while TH the worst.
