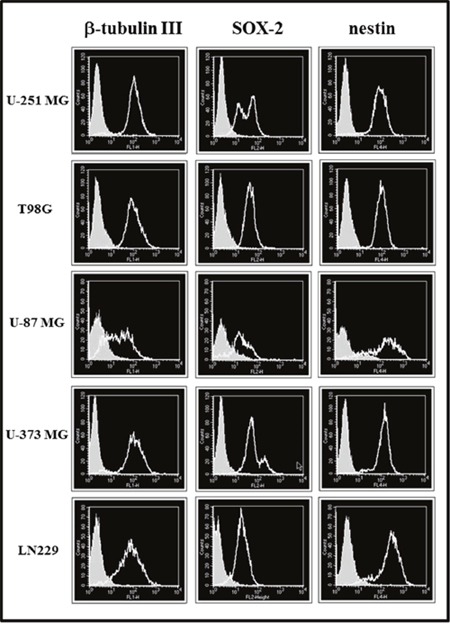
Figure 2. Cytofluorimetric analysis for β-tubulin III, SOX-2 and nestin expression in glioma cell lines maintained in St-M (clear profile).

Full areas show the autofluorescence. The cytofluorimetric profiles from one representative of two independent experiments are shown.
