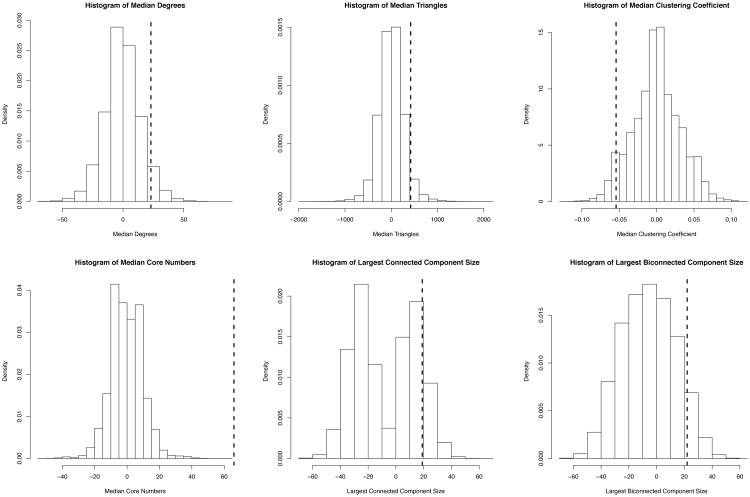
Figure 3.
Histograms of the permutation-based significance tests of the differences between the low and high PHQ9 groups for various graph features. The actual values from the survey are indicated by dotted lines. Except for clustering coefficient, the survey results appear at the right end of each histogram, indicating that the likelihood that PHQ9 is independent of network structure is low. Clustering coefficient also appears unlikely to be independent, although in a different direction.

