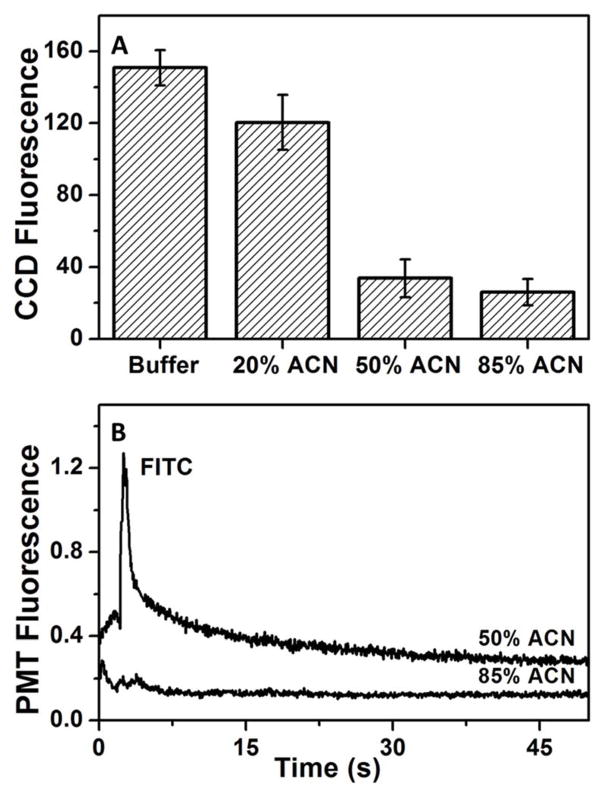
Figure 4.
Retention and elution of FITC on a C8 monolith. (A) Background-subtracted CCD fluorescence from a C8 monolith after retention of 10 μM FITC and sequential rinsing with buffer, 20%, 50% and 85% ACN (n=3). Error bars represent ±1 standard deviation. (B) Sequential elution of 10 μM FITC from a C8 monolith after rinsing with 50% and then 85% ACN. Traces are offset vertically.

