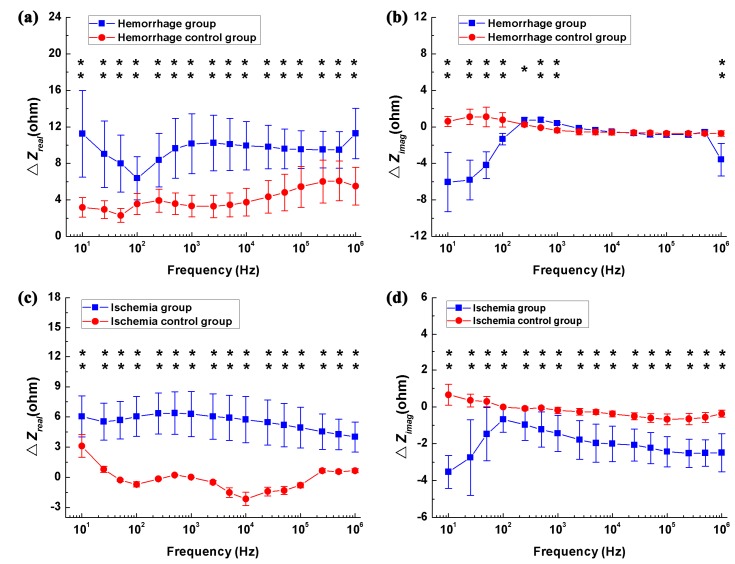
Figure 5.
The change in the brain impedance spectra before and after stroke in relation to the control groups. (a,b) Real and imaginary parts of brain impedance differed in the hemorrhage group (measured before and after blood was injected) and its control (measured 1 min and 33 min after the needle was inserted); (c,d) Real and imaginary parts of brain impedance differed in the ischemia group (measured before and after irradiation with green cold light) and its control group (measured 15 min and 45 min after injection of rose bengal dye). denotes the brain impedance change between the brain impedance ( and ) measured at two time points (A and B, if A and B represent the two time points), i.e., . * p < 0.05, ** p < 0.01.

