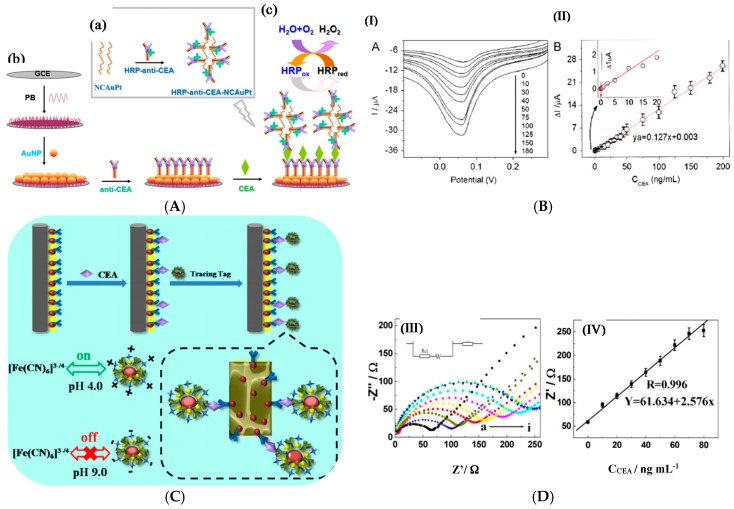
Figure 19.
(A) (a) Preparation of the HRP-anti-CEA-AuPt nanochains as label; (b) sandwich-type recognition; (c) transduction. (B) Corresponding LSV (I) and calibration (II) curves for CEA at different concentrations in PBS + 0.8 mM H2O2. Reprinted from [105], Copyright 2013, with permission from Elsevier. (C) Detection of CEA with AuNPs-Ab2-GOx as label. (D) EIS (III) for CEA at different concentrations: (a) 5, (b) 10, (c) 20, (d) 30, (e) 40, (f) 50, (g) 60, (h) 70 and (i) 80 ng mL−1 in 0.1 M KCl + 5.0 mM Fe(CN)63−/4−; (IV) corresponding calibration curve. Reprinted from [106], Copyright 2016, with permission from Elsevier.

