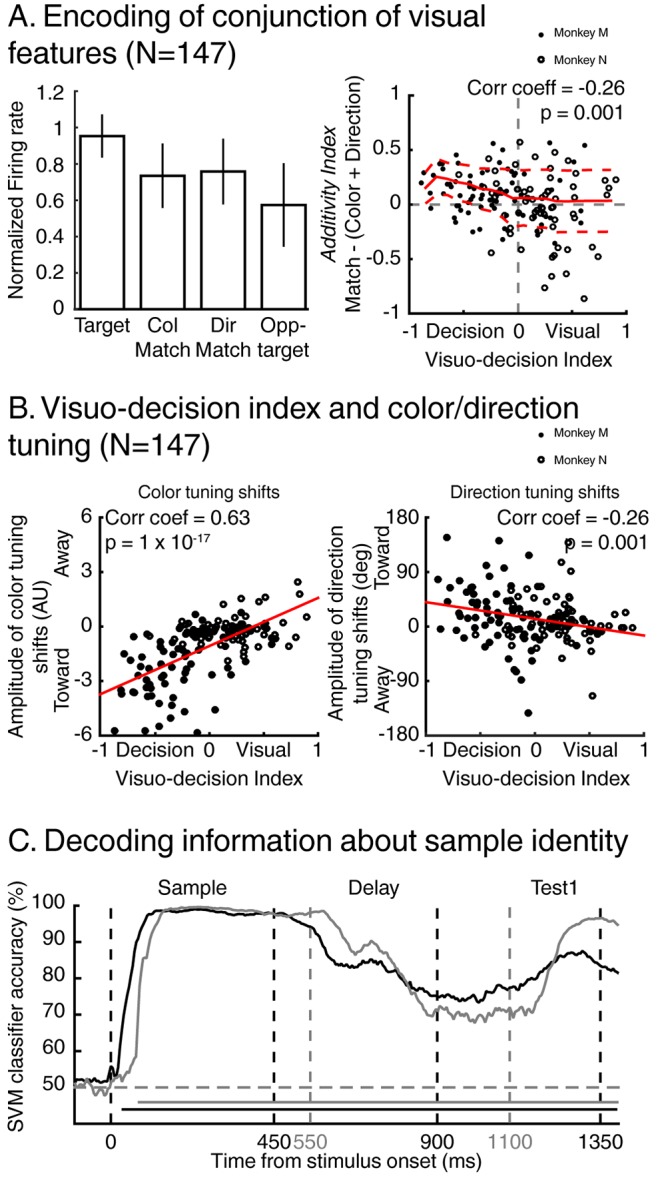
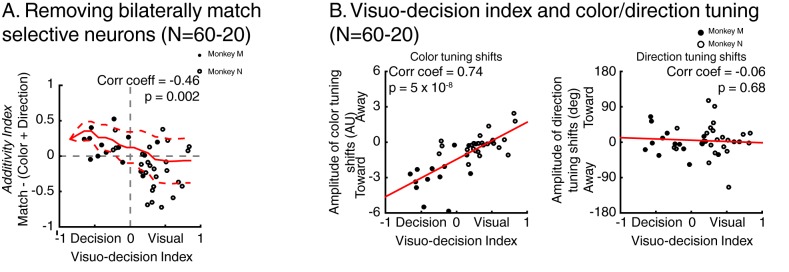
Figure 7. Encoding of visual features along the visuo-decision continuum.
(A) Left panel: averaged normalized response of neurons from the visuo-decision continuum (N = 147) to target, color-match, direction-match and opposite target stimuli. Error bars represent standard deviation of the mean (std). Right panel: Response to relevant conjunction (match) are compared to linear model in which neurons combine color and direction signals linearly (color+direction) as a function of averaged visuo-decision index. Full red line represents sliding averaged additivity index, dotted red lines represent standard deviation to the mean. (B) Effect of feature-based attention as a function of VDI on color selectivity (left, negative and positive values represent shifts toward and away the relevant color respectively), and on direction selectivity (right, positive and negative values represent shifts toward and away the relevant direction, respectively). (C) Time course of decoding accuracy of the identity of the sample by a linear SVM classifier using the activity of the entire population of either 74 LIP neurons (black lines, two-location DCM; chance level = 50%) or 127 LIP neurons (grey lines, one-location DCM; chance level = 50%).


