
Figure 11.
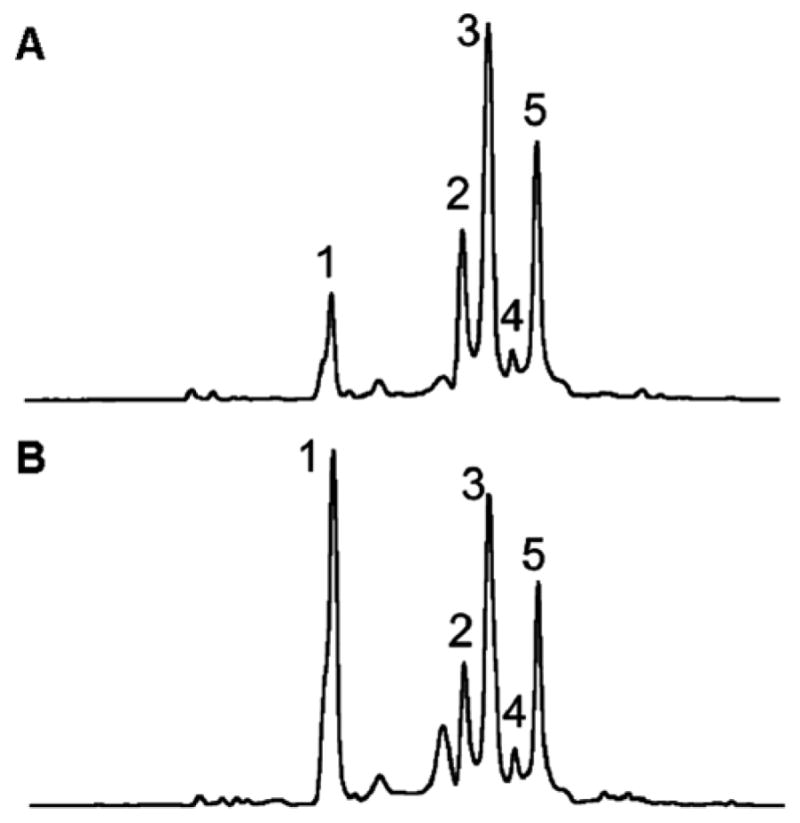
HPLC analysis of ODN 5′-d(TT-Me-FAPy-dG)-TTC-3′. (A) Analysis of ODN synthesis with a short deprotection cycle. (B) Analysis of ODN synthesis with a long deprotection cycle. In both figures, peak 1 represents the formation of pyranose adduct, whereas other peaks are mixture of α and β isomers.57