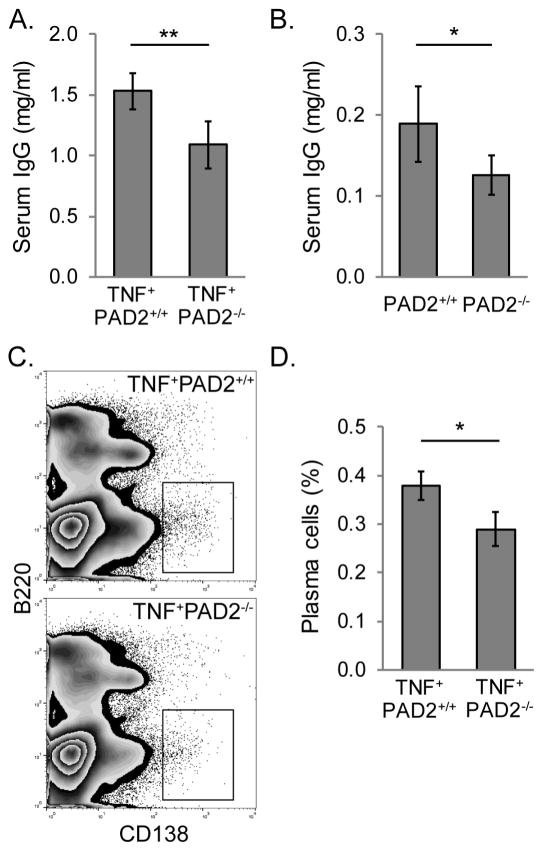
Figure 5. PAD2 contributes to plasma cells and IgG levels in TNFα-induced arthritis.
A. Total serum IgG was quantified for 4–5 month old TNF+PAD2+/+ and TNF+PAD2−/− mice by ELISA with average and SEM graphed (n=8, **p<0.01). B. Total serum IgG was quantified for 2 month old PAD2+/+ and PAD2−/− mice by ELISA with average and SEM graphed (n=7, *p<0.05). Bone marrow from TNF+PAD2+/+ and TNF+PAD2−/− mice was stained for B220 and CD138 and subjected to flow cytometry. C. Representative zebra plots of live cells. D. Average and SEM for the percentage of B220LOCD138HI plasma cells is graphed (n=9, *p<0.05).

