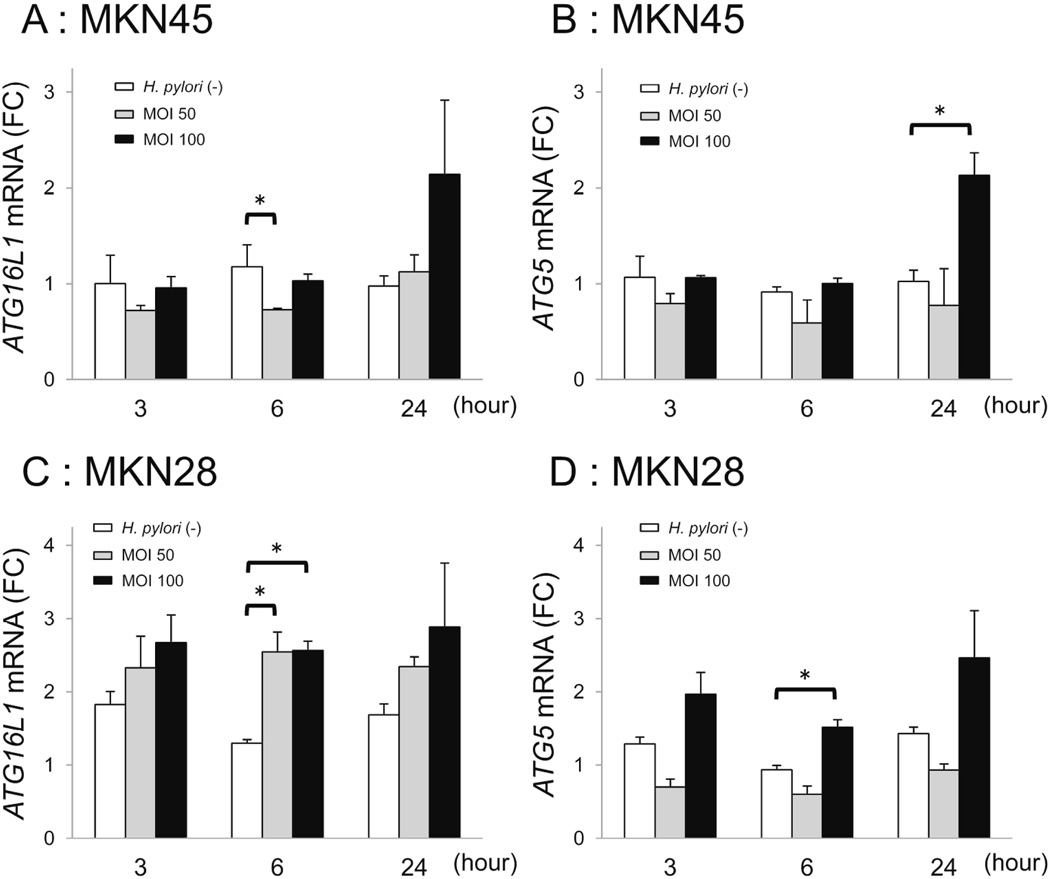
Figure 4.
ATG16L1 and ATG5 mRNA levels in gastric epithelial cells in response to H. pylori infection. A, ATG16L1 mRNA levels in MKN45 cells. B, ATG5 mRNA levels in MKN45 cells. C, ATG16L1 mRNA levels in MKN28 cells. D, ATG5 mRNA levels in MKN28 cells. Cells were infected with H. pylori strain 26695. ATG16L1 and ATG5 mRNA levels in H. pylori-infected and non-infected MKN45 and MKN28 cells were measured at MOI 50 and 100 for 3, 6 and 24 h. Error bars represent the standard deviation of values obtained from three experiments. Statistical differences between treated and control samples were analyzed using Student's t-test.
* p < 0.05.

