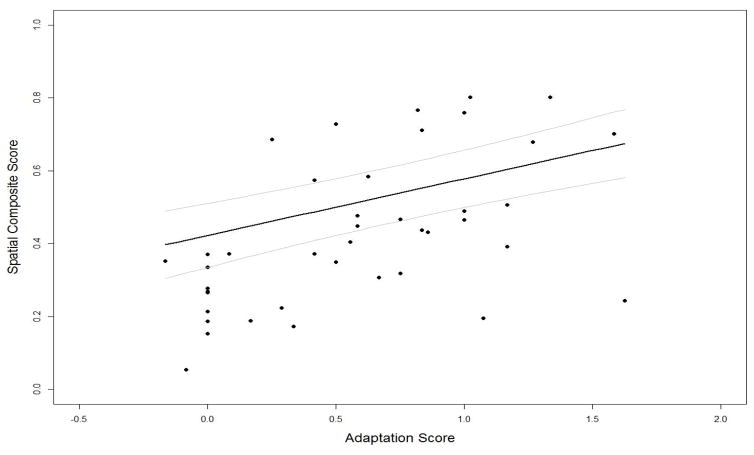
Figure 3.
The relation between children’s adaptation score and their spatial composite score. The prediction line represents the effect of adaptation on spatial task average, while controlling for age, gender, Peabody Picture Vocabulary Test (PPVT-IV) score, spatial vocabulary, and number of spatial words and non-spatial words used during the spatial scene description task. The error bars represent + 1 standard error for point estimates from the regression model.

