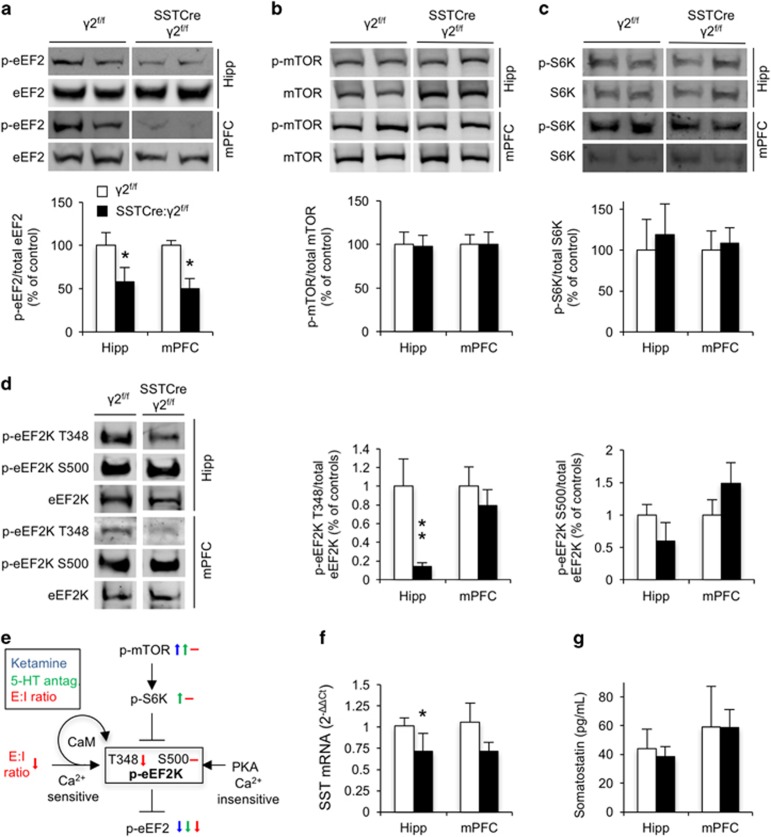
Figure 5.
SSTCre:γ2f/f mice show biochemical changes indicative of reduced intracellular Ca2+ signaling and increased dendritic translational elongation. (a–c) Representative western blottings and summary statistics for phospho-eukaryotic translational elongation factor 2 (p-eEF2), phospho-mammalian target of rapamycin (p-mTOR) and p-S6K in the hippocampus (Hipp) and medial prefrontal cortex (mPFC) normalized to levels of the respective total proteins in the same samples. Western blottings show a reduction of p-eEF2T56/total eEF2 in the Hipp and mPFC of SSTCre:γ2f/f vs γ2f/f control mice (P<0.05, n=10 and 11, for both hipp and mPFC, t-tests) (a). The ratios of p-mTORS2448/mTOR (n=6 and 6; both brain regions) (b) and of p-S6KT389/S6K (c) were unaffected by genotype (P, NS (non-significant); all four comparisons, n=6 and 7, both brain regions, Mann–Whitney). (d) Representative western blottings and summary statistics of phosphorylation of eEF2 kinase (eEF2K) at T348 and S500, normalized to total eEF2K. A two-way analysis of variance for auto-phosphorylation at T348 revealed significant main effects for genotype (F(1,22)=10.50, P<0.01), brain region (F(1,22)=10.35, P<0.01) and interaction among the two (F(1,22)=7.69, P<0.05). Posthoc tests showed significantly reduced eEF2KT348 auto-phosphorylation in the hippocampus of SSTCre:γ2f/f vs γ2f/f controls (P<0.01, n=5 and 8) with a tendency in the same direction in mPFC (P, NS; n=5 and 7, t-tests). By contrast, no genotype-dependent changes were evident for eEF2KS500 (P, NS; for both brain regions; n=5 and 6 (hipp) and 6 and 8 (mPFC), Mann–Whitney). (e) Schematic of signaling cascades converging on the phospho-state and activity of eEF2K as a target downstream of (i) mTOR- and S6K-mediated inhibitory phosphorylation, (ii) excitation–inhibition (E:I) ratio and calmodulin (CaM)-dependent auto-phosphorylation at T348 (activating, black arrow) and (iii) Ca2+-insensitive activating protein kinase A-mediated phosphorylation at S500. Small color-coded arrows illustrate previously reported alterations in phospho-state induced by ketamine (blue29, 30) and 5-HT2C antagonists (green33) and reported here owing to a reduced synaptic E:I ratio (red, unaltered phospho-states are indicated by a horizontal dash). The unaltered phospho-states of mTOR, S6K and eEF2KS500 of SSTCre:γ2f/f mice indicate that reduced phosphorylation of eEF2 involves reduced E:I ratio and reduced CaM-mediated auto-phosphorylation of eEF2K at T348. (f) Somatostatin (SST) mRNA levels quantitated by reverse transcriptase–PCR were reduced in hippocampus (2−ΔΔCt, P<0.05) with a trend in the same direction in mPFC (P, NS; n=5 and 6, Mann–Whitney). (g) SST protein levels quantitated by enzyme-linked immunosorbent assay were not measurably affected by genotype, independent of brain region (P, NS; n=5 and 6 (hipp), 5 and 5 (mPFC), Mann–Whitney). Data represent means±s.e. *P<0.05, **P<0.01, t-tests or Mann–Whitney.

