Table 1.
Compound structures and IC50 values in the biochemical HDAC assays
| Compound ID | Compound structure | HDAC1
|
HDAC2
|
HDAC3
|
HDAC4
|
HDAC5
|
HDAC6
|
HDAC7
|
HDAC8
|
HDAC9
|
HDAC10
|
HDAC11
|
|---|---|---|---|---|---|---|---|---|---|---|---|---|
| IC50 µM |
IC50 µM |
IC50 µM |
IC50 µM |
IC50 µM |
IC50 µM |
IC50 µM |
IC50 µM |
IC50 µM |
IC50 µM |
IC50 µM |
||
| Ebselen |
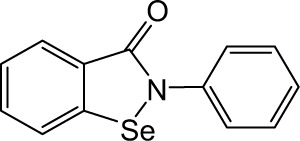
|
>10 | >10 | >10 | >10 | 3.49 | 6.99 | >10 | 1.21 | 3.75 | >10 | >10 |
| Ebselen oxide |
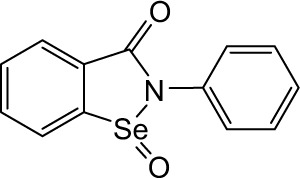
|
2.26 | >10 | 4.18 | 4.70 | 1.49 | 2.98 | 1.88 | 0.20 | 2.37 | >10 | >10 |
| Thr101 |
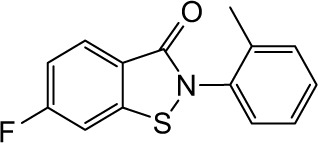
|
3.62 | >10 | 4.24 | 6.07 | 1.57 | 4.14 | 3.43 | 0.66 | 3.77 | >10 | >10 |
| RBC-2004 (Ebsulfur) |
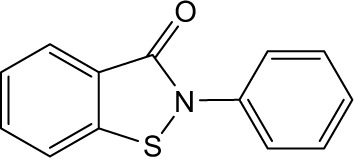
|
1.65 | >10 | 2.72 | 4.12 | 1.49 | 2.89 | 1.51 | 0.19 | 1.70 | >10 | >10 |
| Benzisothiazol |
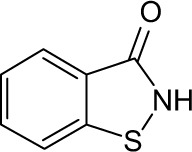
|
>10 | >10 | >10 | >10 | >10 | 3.20 | >10 | >10 | >10 | >10 | >10 |
| RBC-2005 |
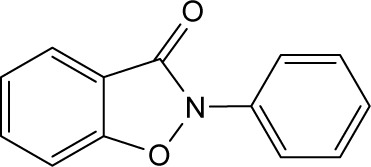
|
>10 | >10 | >10 | >10 | >10 | >10 | >10 | >10 | >10 | >10 | >10 |
| RBC-2006 |
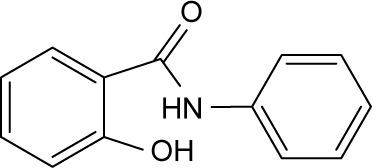
|
>10 | >10 | >10 | >10 | >10 | >10 | >10 | >10 | >10 | >10 | >10 |
| RBC-2008 |
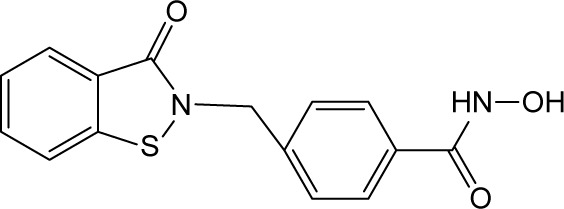
|
0.25 | >10 | 3.70 | 5.40 | 0.94 | 0.003 | 4.10 | 0.064 | 3.80 | >10 | >10 |
| RBC-2009 |
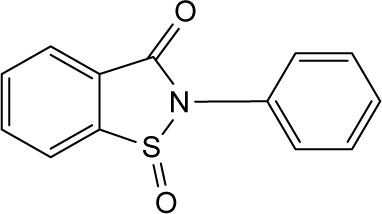
|
>10 | >10 | >10 | >10 | >10 | >10 | >10 | >10 | >10 | >10 | >10 |
| RBC-2010 |
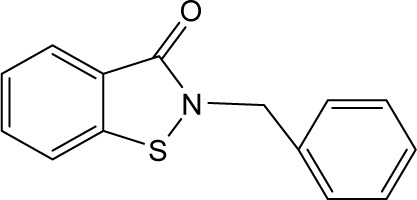
|
6.58 | >10 | 5.01 | >10 | 4.79 | 11.32 | 6.08 | 0.63 | 6.19 | >10 | >10 |
| RBC-2011 |
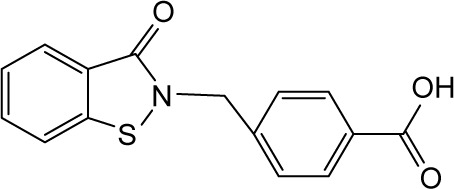
|
4.00 | >10 | 5.30 | 9.90 | 3.30 | >10 | 4.10 | 0.56 | 4.60 | >10 | >10 |
| RBC-2012 |
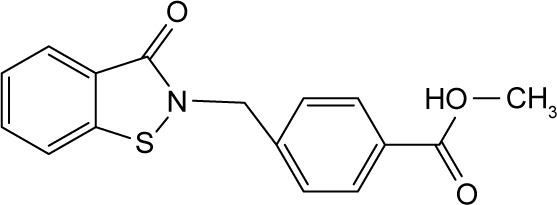
|
8.80 | >10 | 8.20 | >10 | 5.50 | >10 | 8.79 | 1.03 | >10 | >10 | >10 |
| SAHA |

|
0.293 | 0.683 | 0.435 | 27.400 | 12.200 | 0.018 | >10 | 1.130 | >10 | 0.604 | 0.597 |
Abbreviations: HDAC, histone deacetylase; IC50, half maximal inhibitory concentration.
