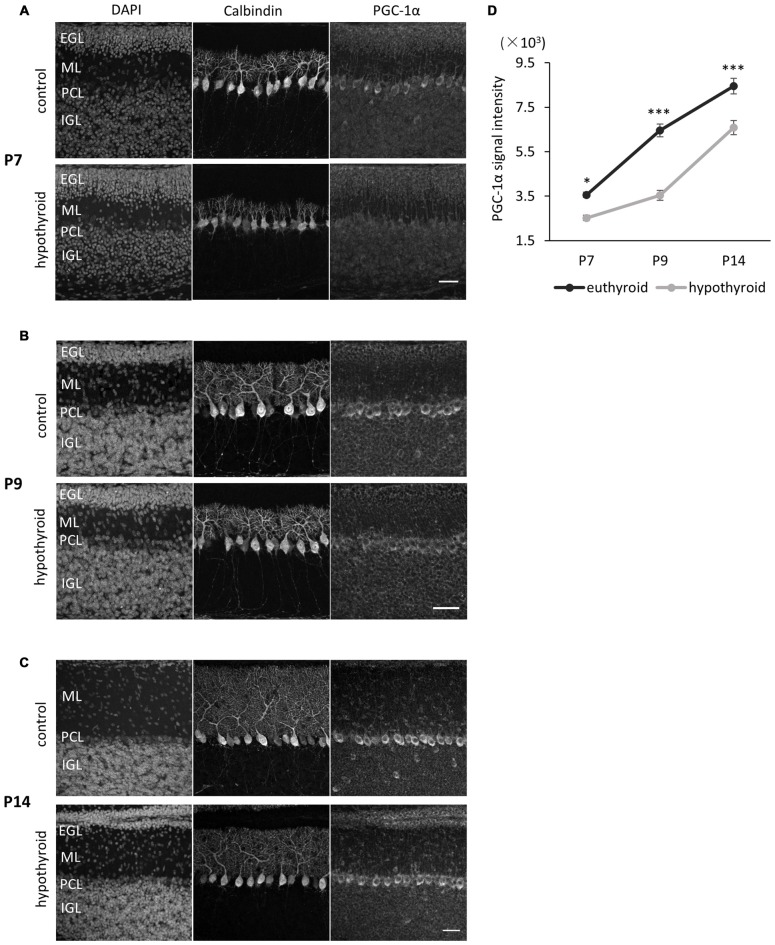
Figure 3.
PGC-1α expression in Purkinje cells is downregulated in hypothyroid mice. (A–C) PGC-1α expression was compared at P7 (A), P9 (B) and P14 (C). Representative images from four mice in each condition are shown. Dendritic growth of Purkinje cells is retarded in the hypothyroid condition. At P14 (C), the EGL is thicker in hypothyroid animals compared to control animals. Each section was immunostained with anti-Calbindin and anti-PGC-1α. DNA was counterstained with 4′,6-diamidino-2-phenylindole (DAPI). Scale bars, 40 μm. (D) Quantitative comparison of PGC-1α expression in Purkinje cells in control (euthyroid) and hypothyroid animals. Data represent mean ± SEM, N = 15 cells from four mice from two independent experiments for each points, *p < 0.05, ***p < 0.001, two-way analysis of variances (ANOVA) with Tukey’s HSD post hoc analysis.

