Figure 4.
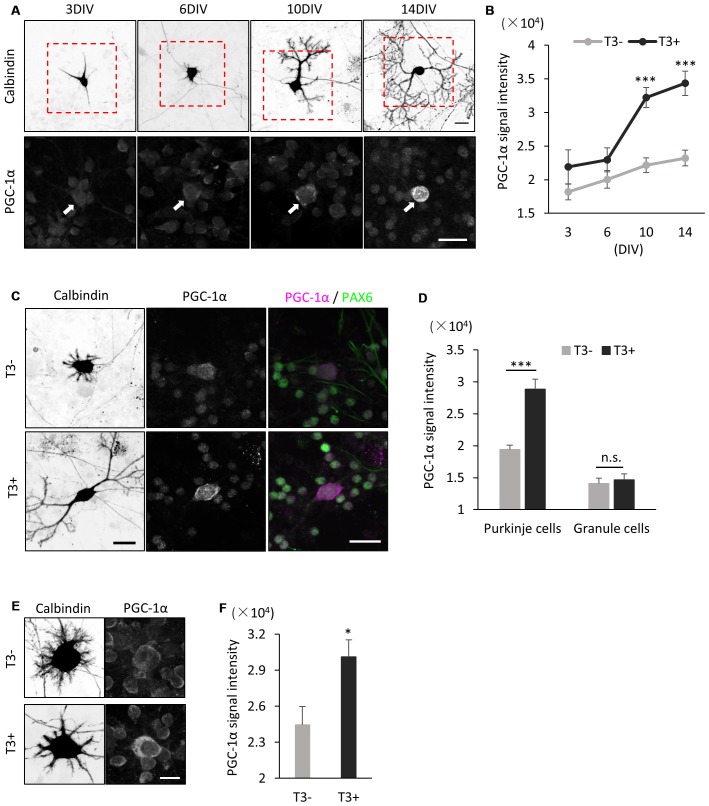
PGC-1α expression is induced in cultured Purkinje cells by T3 treatment. (A) Cerebellar cells were cultured in the presence of 10 nM T3 and then immunostained with anti-Calbindin and PGC-1α at the indicated day in culture. Boxed regions in the upper panels are enlarged in lower panels. PGC-1α expression is gradually increased in Purkinje cells (arrows) from 6 DIV. Scale bars, 20 μm. (B) Quantitative comparison of PGC-1α expression in Purkinje cells cultured with (black dots and line) or without (gray dots and line) T3. Data represent mean ± SEM, N = 15 cells for each points, ***p < 0.001, two-way ANOVA with Tukey’s HSD post hoc analysis. (C) Dissociated cerebellar cells were cultured with or without T3 treatment and immunostained for Calbindin, Pax-6 and PGC-1α at 10 DIV. Scale bars, 20 μm. (D) Quantitative comparison of PGC-1α expression in Purkinje cells and granule cells cultured with or without T3. (E,F) Immunofluorescent images (E) and quantitative comparison (F) of PGC-1α expression in Purkinje cells treated with or without T3 for 24 h. Scale bar, 10 μm. (D,F) The average pixel intensities of PGC-1α signals in the cell soma were measured. Mean ± SEM, N = 15 for each point, *p < 0.05, ***p < 0.001, Student’s t test.

