Figure 5.
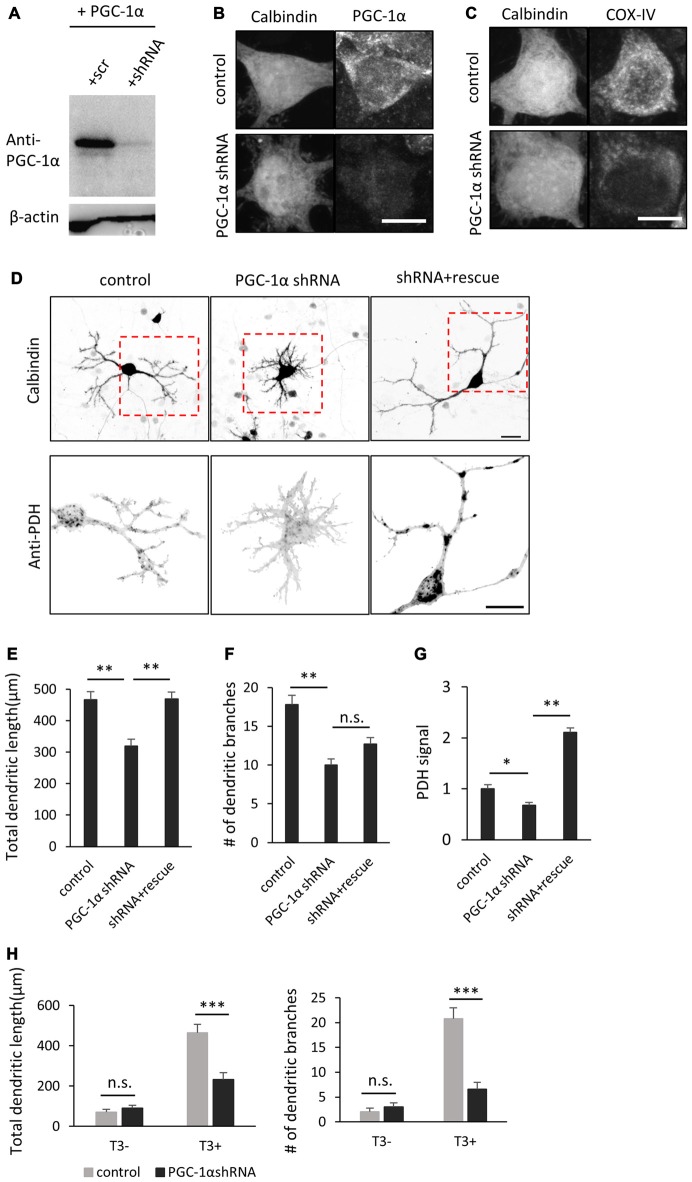
PGC-1α knockdown inhibits T3-induced dendritic growth in Purkinje cells. (A) HEK293T cells expressing mouse PGC-1α were transfected with PGC-1α-scramble (scr) or short hairpin RNA (shRNA) construct and analyzed by western blotting with anti-PGC-1α and anti-β-actin antibodies. (B,C) Cultured Purkinje cells were transfected with PGC-1α-shRNA or scr-shRNA (control) constructs and stained for Calbindin and PGC-1α (B) or Calbindin and cytochrome C oxidase IV (COX-IV) (C) at 10 DIV. Scale bars, 10 μm. (D) Representative images of Purkinje cells transfected with scr shRNA (control), PGC-1α shRNA (PGC-1α shRNA), or PGC-1α shRNA plus an shRNA-resistant mutant of PGC-1α (shRNA + rescue). Cells were cultured in the presence of 10 nM T3 until 10 DIV and immunostained with anti-Calbindin and anti-PDH antibodies. Boxed regions in the upper panels are enlarged in lower panels. Scale bars, 20 μm. (E–G) Quantitative analyses of the total dendritic length (E), number of dendritic branches (F) and PDH signal (G). Data represent mean ± SEM, N = 30 for each point, **p < 0.01 and *p < 0.05, one-way ANOVA with Tukey’s HSD post hoc analysis. (H) Quantification of the effects of PGC-1α knockdown on Purkinje cells morphology in the presence or absence of T3. Mean ± SEM, N = 15 for each point, ***p < 0.001, Student’s t test.

