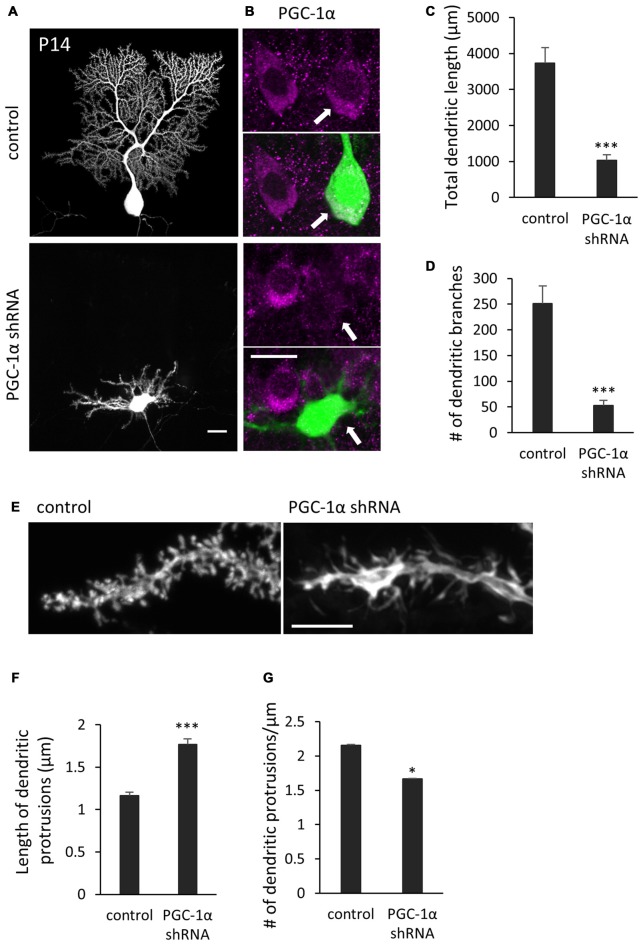
Figure 7.
Knockdown of PGC-1α inhibits dendritic outgrowth in vivo Purkinje cells. (A) Representative images of Purkinje cells transfected with scr shRNA (control) or PGC-1α shRNA construct. Scale bar, 20 μm. (B) Dual color images of GFP derived from shRNA constructs (green) and immunostaining with anti-PGC-1α (magenta). Scale bar, 20 μm. (C,D) Quantitative analyses of the total dendritic length (C) and number of dendritic branches (D) in Purkinje cells expressing scr shRNA (control) or PGC-1α shRNA constructs. Data represent mean ± SEM, N = 12 cells from three mice, ***p < 0.001, Student’s t test. (E) Representative images of distal dendrites of Purkinje cells expressing scr shRNA (control) and PGC-1α shRNA. Scale bar, 5 μm. (F,G) The length (F) and number (G) of dendritic protrusions in the Purkinje cells expressing scr shRNA (control) or PGC-1α shRNA (shRNA). Data represent mean ± SEM, N = 200 (control) and N = 259 (shRNA). Twelve cells from three mice were analyzed for each group. Data represent mean ± SEM, ***p < 0.001, *p < 0.05, Student’s t test.

