Figure 5.
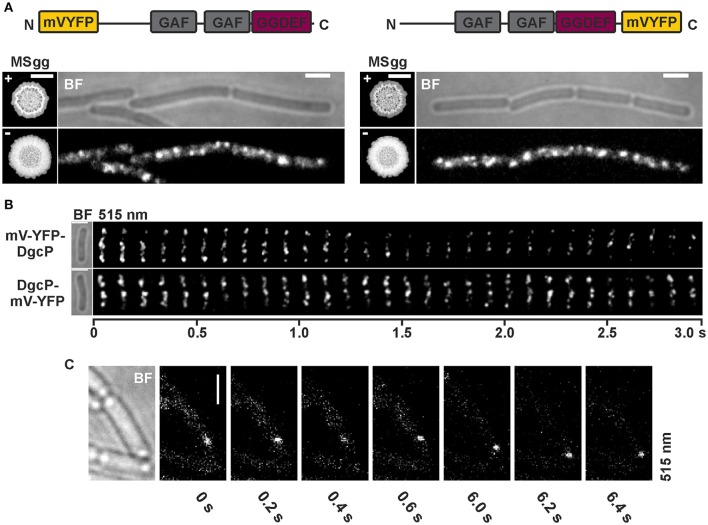
Subcellular localization and dynamics of DgcP in B. subtilis NCIB3610. (A) Epifluorescence of cells overexpressing mV-yfp-dgcP (left panel, strain NCIB3610-PB85; amyE::Pxyl-mV-yfp-dgcP) and dgcP-mV-yfp (right panel, strain NCIB3610-PB86; amyE::Pxyl-dgcP-mV-yfp) 45 min after induction with 0.1% (v/v) xylose (Scale bars: 2 μm). The “MSgg panel” depicts the functionality assay for the corresponding fusion protein/strain in the presence and absence of 0.1% (v/v) xylose (left: DS1809-PB55-PB85, ΔdgcK, -P, -W, Pxyl-ydaK-N, amyE::Pxyl-mV-yfp-dgcP; right: DS1809-PB55-PB86, ΔdgcK, -P, -W, Pxyl-ydaK-N, amyE::Pxyl-dgcP-mV-yfp). Scale bar: 5 mm. Color code for schematic representation of corresponding fusion protein (domain organization predicted by SMART): gray: GAF (domain found in cGMP-specific phosphodiesterases, adenylyl and guanylyl cyclases and phytochromes which often serves as a cyclic nucleotide binding domain), purple: GGDEF domain (active site motif GGEEL), yellow: N- and C-terminal mV-YFP respectively. (B) Time-lapse fluorescence microscopy of DgcP fusions produced. Images were captured every 100 ms under continious illumination (515 nm). Bars: 2 μm. (C) Time-lapse microscopy of DgcP-mV-YFP produced from the original locus (strain NCIB3610-PB08). Images were captured at the time points (seconds) indicated next to the panels at time intervals of 200 ms. Bars: 2 μm.

