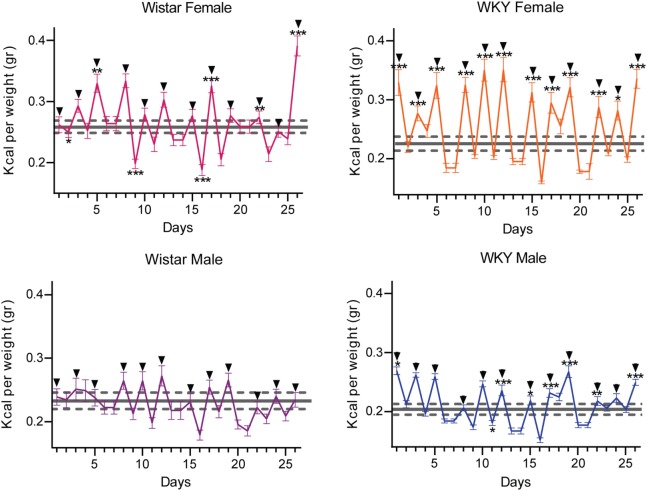
Figure 3.
Caloric consumption variation during test and no test days during the sugar binging-like behavior protocol. The data of the control group are represented as mean ± SEM (gray doted lines); test days distinguished by a black arrow on top. Two-way ANOVA using variation factors time and treatment with Sidak’s multiple comparisons test. (ANOVA was calculated using the raw data.) (*P < 0.05, **P < 0.01, ***P < 0.001).

