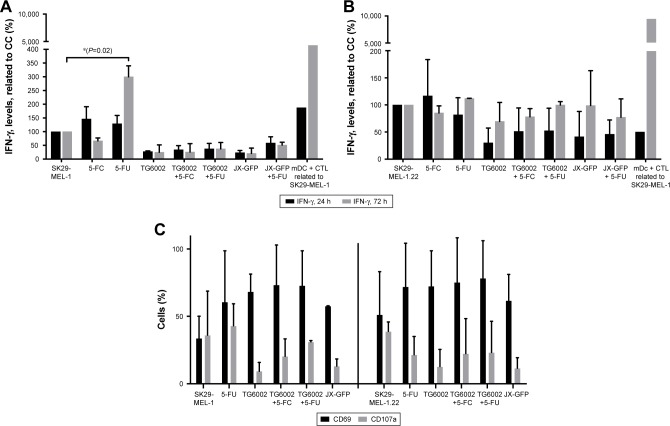
Figure 6.
Activation of CTLs after coculture of virally or drug-induced TCLs with iDCs and CTLs for 24 and 72 h was analyzed by IFN-γ ELISA and flow cytometry.
Notes: (A) Activation of CTL was analyzed by IFN-γ ELISA. Data of cocultivation of SK29-MEL-1 melanoma cells are shown. (B) Activation of CTL was analyzed by IFN-γ ELISA. Data of cocultivation of HLA-loss clone SK29-MEL-1.22 melanoma cells are shown. (C) Cocultivation of virally or drug-induced TCLs with iDCs and CTLs was performed. Activation markers CD69 and CD107a were stained, and flow cytometry analyzes were performed. Left: coculture with SK29-MEL-1 melanoma cells and right: coculture with SK29-MEL-1.22 melanoma cell clone. *P≤0.05.
Abbreviations: h, hour; CC, cell control (untreated cells); CTLs, cytotoxic T lymphocytes; TCL, tumor cell lysates; IFN, interferon; ELISA, enzyme-linked immunosorbent assay; iDCs, immature dendritic cells; mDC, mature dendritic cells; 5-FU, 5-fluoruoracil; 5-FC, 5-fluorcytosin.

