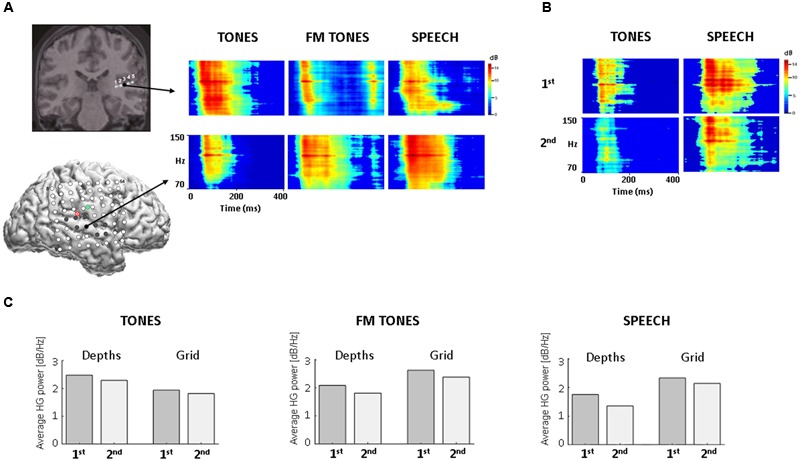
FIGURE 1.

HG spectral power as a function of stimulus and recording site in auditory cortex. (A) Time-frequency plots of trial-averaged HG power for pure tones, FM tones, and speech, with time on the x axis (0–400 ms) and frequency on the y axis (70–150 Hz, high-gamma). (Top): coronal view from 3D MRI showing five co-registered contacts on the posterior depth (DP) electrode (for different view, see Supplementary Figure 1). Arrow projects from largest HG response sites (DP3, black filled). (Bottom): Sagittal view from 3D MRI showing location of co-registered grid electrodes on lateral right hemisphere (for larger view, see Supplementary Figure 1); red and green circles denote point of insertion for the posterior depth (DP, red) and anterior depth (DA, green). Filled electrodes denote locations of adapting HG responses. Arrow projects from largest HG response sites (black filled). (B) Time-frequency plots of HG power for the 1st and 2nd repetitions of tones (Left) and speech (Right) from the largest grid response site (RH27). Time-frequency plots are scaled to the high-gamma frequencies for improved visibility. (C) Bar graphs showing changes in average HG power by 1st and 2nd stimulus repetition at depth and grid sites.
