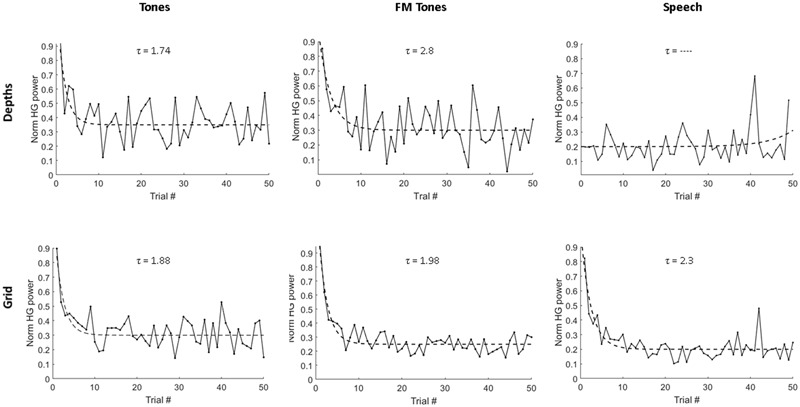
FIGURE 2.

Single-trial adaptation of HG power as a function of stimulus and recording site. Plots show average HG response magnitude for depth electrodes (Top) and grid electrodes (Bottom) across first 50 repeated trials for pure tones, FM tones and speech. Dashed lines denote exponential fits used to derive adaptation time constants (τ), measured as number of stimulus repetitions and displayed above each plot.
