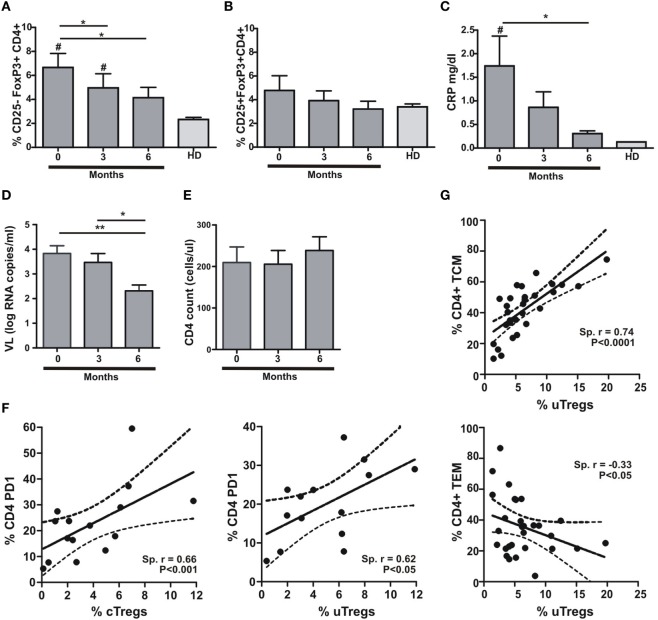
Figure 2.
Anti-TB treatment induces changes in uTreg but not in cTreg populations in HIV-TB patients. (A) Evaluation of uTreg (CD4+CD25–FoxP3+), (B) cTreg (CD4+CD25+FoxP3+) frequencies by flow cytometry, (C) C-reactive protein (CRP) plasma concentrations, (D) CD4+ lymphocytes count, and (E) HIV RNA copies per milliliter in peripheral blood from HIV-TB individuals along anti-TB treatment (0, 3, and 6 months); values obtained from healthy donors (HD) were used as controls. Friedman test for paired samples was used for comparisons between consecutive visits for each population, cTreg and uTreg (**p < 0.01; *p < 0.05). For comparison between each visit and values in HD group, Mann–Whitney test was performed (#p < 0.05 was consider significant). (F) Correlation analysis between the % of cTreg and the % of PD1+CD4+ T lymphocytes (left) and between the % of uTreg and the % of PD1+CD4 T cells (right) from HIV-TB individuals. Spearman rank test was used for the evaluation of the correlation. (G) Correlation analysis between the % of uTreg and the % of CD4+ TCM lymphocytes (upper panel) and between the % of uTreg and the % of CD4+ TEM cells (lower panel) from HIV-TB individuals. Spearman rank test was used to test correlation.

