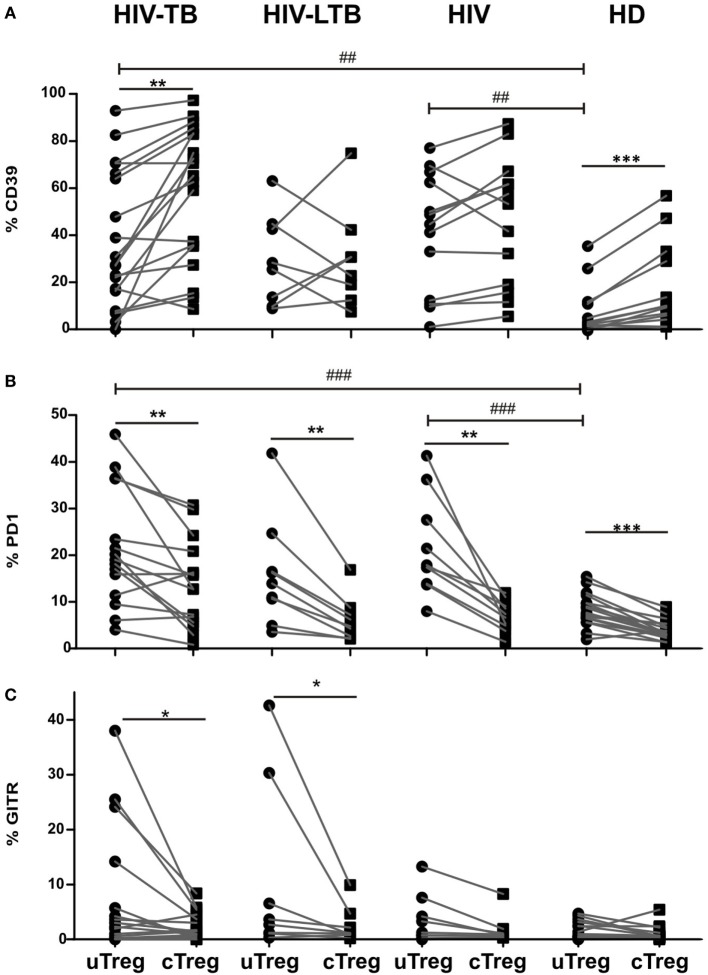
Figure 3.
uTreg differ in CD39, programmed cell death protein 1 (PD1) and glucocorticoid-induced tumor necrosis factor receptor (GITR) expression levels with cTreg population. Comparison of the (A) CD39, (B) PD1, and (C) GITR expression between uTreg and cTreg from HIV-TB, HIV-LTB, HIV, and healthy donors (HD) individuals. Wilcoxon rank test was used for paired statistical analysis. For the comparison between the four groups, Kruskal–Wallis test was performed followed by Dunns posttest. *p < 0.05; **p < 0.01; ***p < 0.001; ##p < 0.01; ###p < 0.001.

