Figure 6.
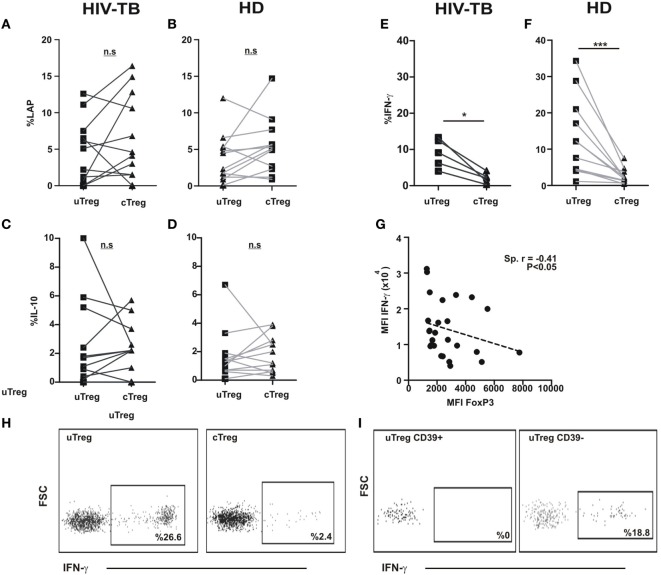
uTregs produce a distinct pattern of cytokines and high levels of IFN-γ. PBMC from HIV-TB and healthy donors (HD) were stimulated with PMA/Io and analyzed by flow cytometry for the indicated cytokines. Comparison of latency-associated peptide (LAP) expression between uTreg and cTreg from (A) HIV-TB and (B) HD persons. Analysis of IL-10 production between uTreg and cTreg from (C) HIV-TB and (D) HD individuals. Evaluation of IFN-γ production in the uTreg and cTreg populations from (E) HIV-TB and (F) HD. (G) Correlation analysis between FoxP3 and IFN-γ mean fluorescence intensity (MFI) in Tregs. Wilcoxon test was used for statistical analysis. (H) Representative flow cytometry dot plots depicting IFN-γ production from uTregs (left) and cTregs (right). (I) Representative flow cytometry graphs showing IFN-γ production from CD39+ uTregs (left) and CD39− uTregs (right). Each point represents an individual subject. Asterisks indicate significant differences between groups. *p < 0.05; ***p < 0.001. Spearman test was performed for correlation analysis.

