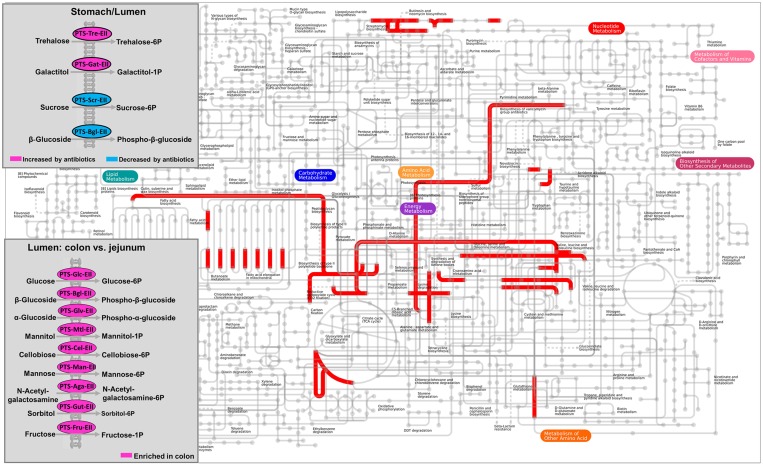
FIGURE 5.
Mapping the KEGG orthology groups (KOs) against KEGG modules based on the metagenomic prediction results. In the overall metabolic map, pathways that are overrepresented in the mucosa versus lumen of duodenum were indicated in red. The carbohydrate transport phosphotransferase systems was highlighted in box. The significance of KOs selected was declared at FDR q < 0.05.

