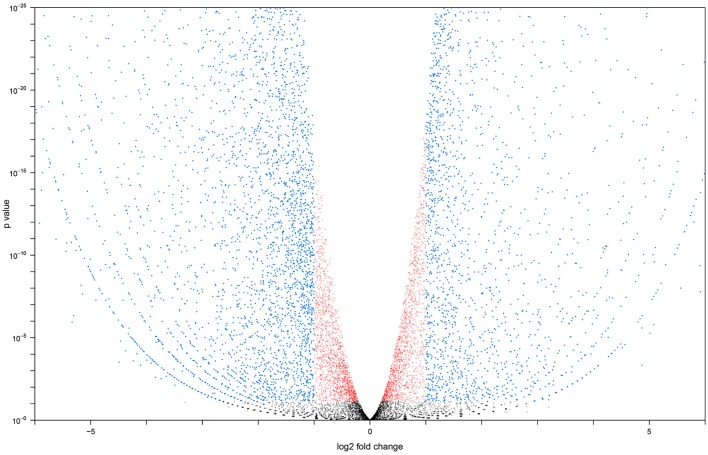
Figure 1.
Volcano plot generated with larval vs. adult transcript data. Transcripts altered at a less than log 2 fold level are in red, transcripts altered at a greater than log 2 fold level, but with a P < 0.05 are in blue. Transcripts with an expression level altered more than log 2 fold and have a P > 0.05 are in black.

