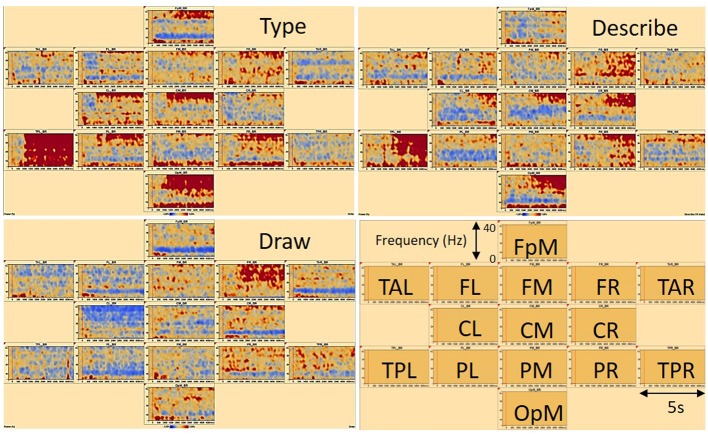
FIGURE 4.
Time-frequency displays of a typical (female) participant showing associated brain regions in frontal, temporal, central, parietal, and occipital areas of the brain. FpM, fronto-polar midline; FL, frontal left; FM, frontal midline; FR, frontal right; TAL, temporal anterior left; TAR, temporal anterior right; TPL, temporal posterior left; TPR, temporal posterior right; CL, central left; CM, central midline; CR, central right; PL, parietal left; PM, parietal midline; PR, parietal right; OpM, occipito-polar midline. The signal magnitude on the y-axes (Power %) reflects the estimated neural activity in the various brain regions during the experimental conditions type, describe, and draw compared to baseline (–300 to 0 ms) activity. On the x-axes, baseline activity and 5 s recording time are displayed. Note that red areas indicate synchronization (ERS) and blue areas indicate desynchronization (ERD) of associated brain activity.

