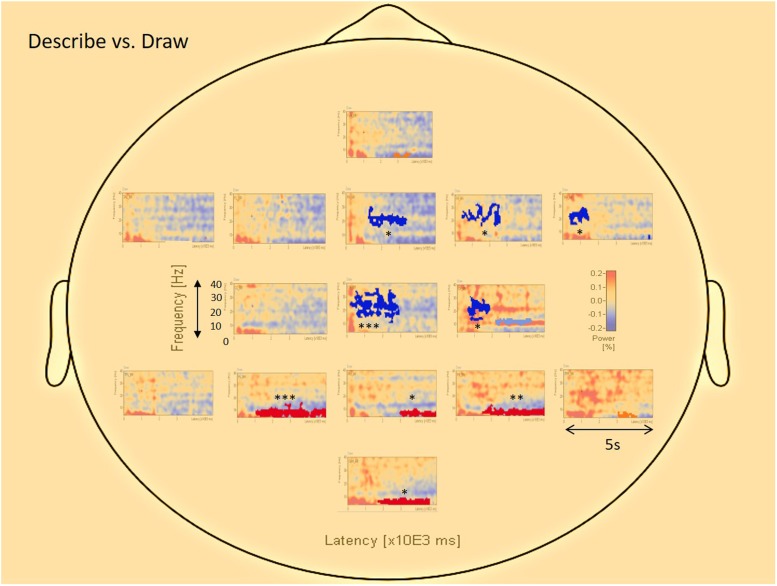
FIGURE 5.
The average visualization of significant (∗∗∗p < 0.0005; ∗∗p < 0.005; ∗p < 0.05) data clusters in the various sources of interest when the describe condition is compared to the draw condition. Center and (right) frontal areas represent pre-motor, motor, and areas of creativity, whereas parietal and occipital areas represent sensory-motor integration and visual interpretation. Blue colors represent negative clusters, while red colors represent positive clusters. Each area in the central and frontal region is dominated by activity in the upper alpha (10–13 Hz), beta (12–20 Hz), and gamma (20–34 Hz) range, especially during the early parts of cognitive processing (ideation phase). Areas in the parietal and occipital region are dominated by activity in the theta (3–8 Hz) and alpha (8–13 Hz) range, almost for the entire drawing duration of the trials (execution phase).

