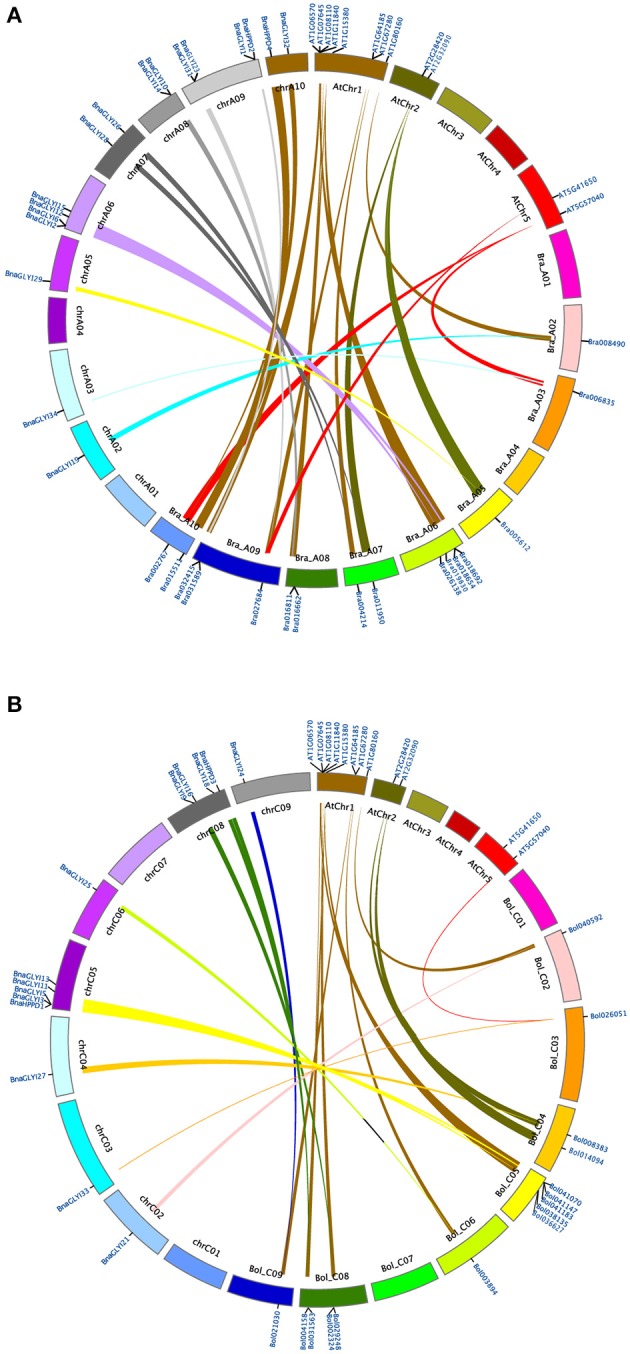
Figure 3.

Synteny analysis map of VOC gene in B. napus, B. rapa, B. oleracea, and A. thaliana chromosomes. (A) Genes located on B. napus A genome are syntenic with genes of B. rapa and A. thaliana. (B) Genes located on B. napus C genome are syntenic with genes of B. oleracea and A. thaliana. The different degrees of thickness of lines indicate their synteny relationship (thick, strong; thin, weak).
