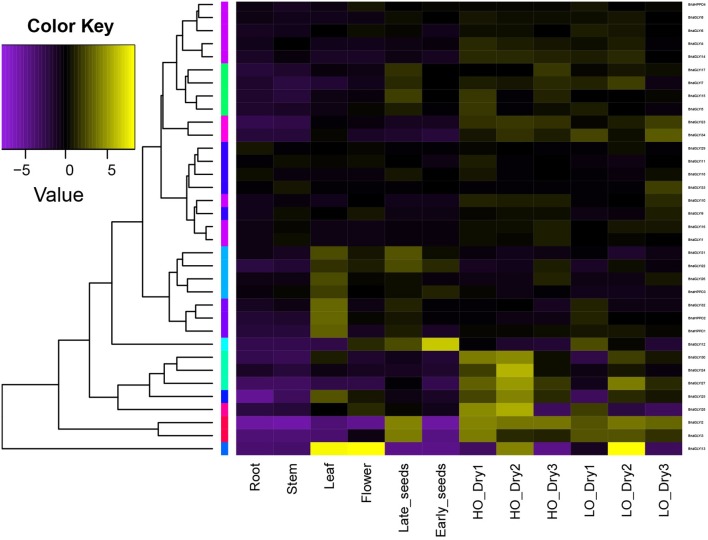
Figure 7.
Hierarchical clustering of the expression profiles of BnaVOC genes in different tissues and the seeds in drought stress. The log-transformed values of the relative expression levels of BnaVOC genes were used for hierarchical cluster analysis (original data shown in Table S2). The color scale represents relative expression levels with increased transcript (yellow) or decreased transcript (purple). Late_stage seeds were drought stress treated (HO_Dry1, HO_Dry2, HO_Dry3 indicate high oil content B. napus lines were treated for 1, 2, 3 weeks, respectively; LO_Dry1, LO_Dry2, LO_Dry3 indicate low oil content B. napus lines were treated for 1, 2, 3 weeks, respectively).

