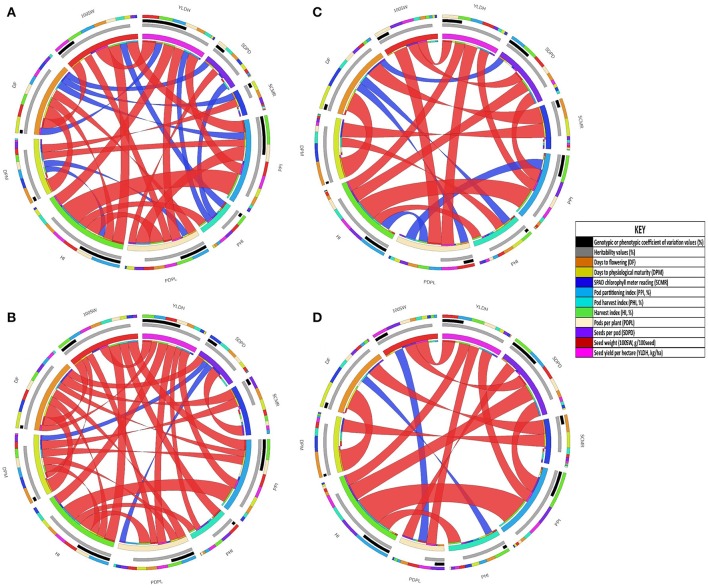
Figure 3.
Graphical display of the correlation matrices, variance coefficients and heritability of traits in Andean gene pool diversity panels grown under drought stress and non-stress treatments at Hawassa, Ethiopia, in 2009. (A) phenotypic correlation under drought stress, (B) genotypic correlations under drought stress, (C) phenotypic correlation under non-stress and (D) genotypic correlations under non-stress. The color specifications in the subfigures: the outer circle is the correlation coefficient values of a trait with others represented in different colors (all traits have separate colors as indicated in Key) and sizes irrespective of its direction, the middle circles black represent the sizes of genotypic or phenotypic coefficient of variation values and gray represent sizes of heritability values which proportional to the length of circle segment (for the detail values refer table 1). The ribbons in the inner circle represent significant correlations red (significant at 0.01 p value) and blue (significant at 0.05 p value). Ribbons are twisted if the correlation is negative and flat if positive (detail correlation coefficient values presented in Supplementary Table 1).

