
Figure 5.
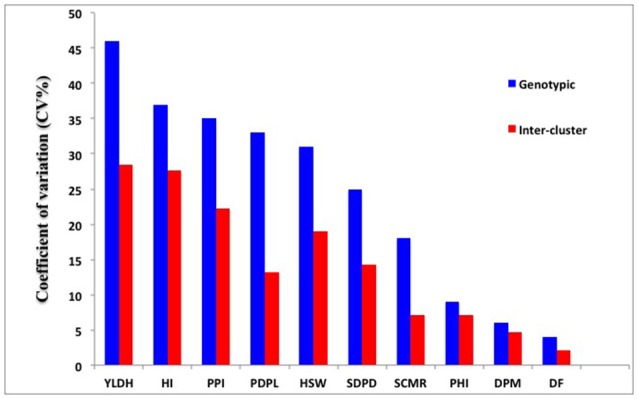
The relative contribution of the multiple traits to the phenotypic differentiation in common bean diversity panels evaluated under drought stress at a genotypic and inter-cluster level as demonstrated by coefficient of variation (CV%) values. Y-axis is CV value for the trait and x-axis is multiple traits contributing to the group formation. Refer Table 1 for trait abbreviations.