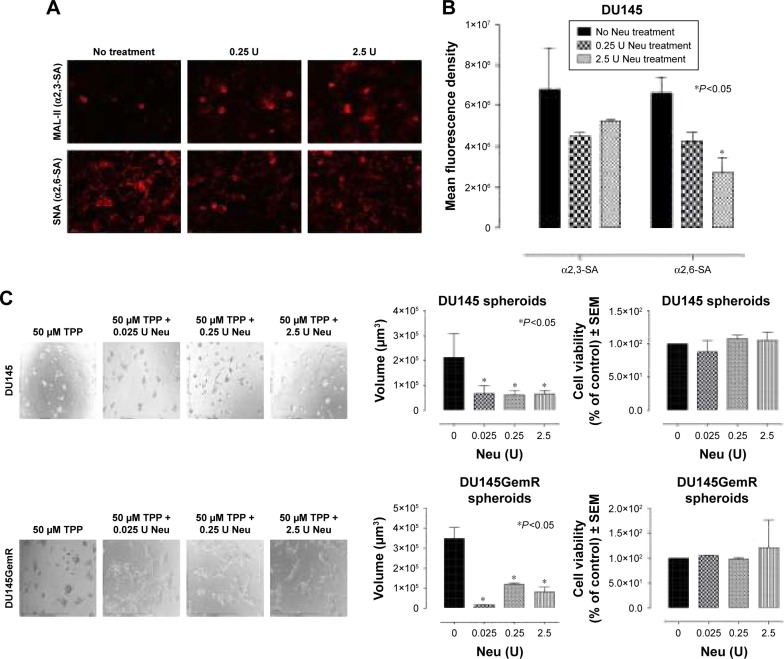
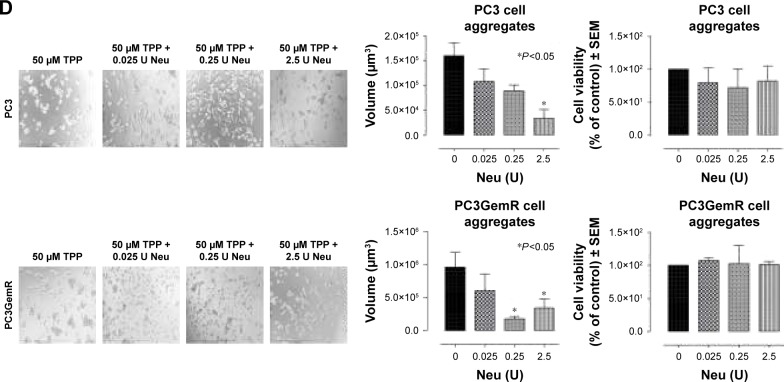
Figure 10.
(A) Fluorescent microscopy images of DU145 cells stained with biotinylated lectins followed by DyLight 594 streptavidin. The cells were treated with 0.25 or 2.5 U neuraminidase (Neu) (Vibrio cholerae) for 24 hours before staining. Images were taken with epiflourescent microscope with 20× objective. (B) Quantitative analysis was done by assessing the density of cell staining corrected for background in each panel by using Corel Photo Paint 8.0 software. Each bar in the graphs represents the mean corrected density of staining ± SE (error bars) for all cells within the respective images. Results were compared by a one-way ANOVA at 95% confidence using Fisher’s LSD test. (C and D) Phase-contrast images of DU145, DU145GemR, PC3, and PC3GemR treated with a combination of 50 μM cyclo-RGDfK(TPP) peptide and Neu at concentrations of 0.025, 0.25, or 2.5 U for 6 days. A total of 10,000 cells were plated per well in a 96-well plate. MCTS volume was measured by using the method described in Figure 8. Each bar in the graph represents mean MCTS volume ± SE (error bars) for all MCTS within the representative images. Results were compared by one-way ANOVA at 95% confidence interval using Fisher’s LSD test. Data are representation of one of two independent experiments showing similar results. Viability of DU145, DU145GemR, PC3, and PC3GemR attached cells and MCTS using WST-1 assay. Cell viability was expressed as a percent of control SEM of two independent experiments. Statistical analysis was carried out by using GraphPad Prism, and the results were compared by one-way ANOVA at 95% confidence using Fisher’s LSD test.
Abbreviations: MCTS, multicellular tumor spheroid; cyclo-RGDfK(TPP), cyclic Arg-Gly-Asp-D-Phe-Lys peptide modified with 4-carboxybutyl-triphenylphosphonium bromide; ANOVA, analysis of variance; SE, standard error; SEM, standard error of mean; LSD, least significant difference; WST, cell proliferation reagent.


