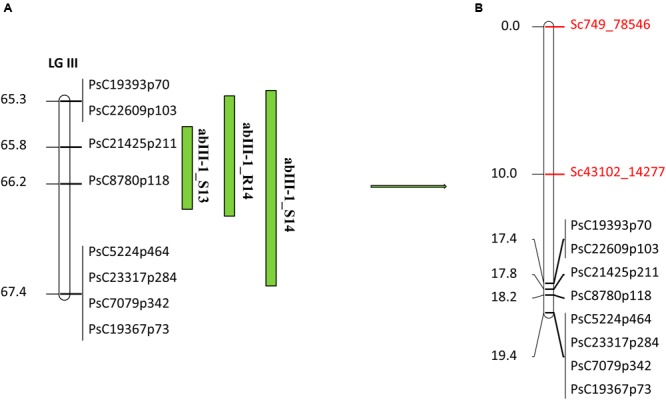
FIGURE 6.

Quantitative trait locus abIII-1 based on SNP linkage map in PR-19 (Jha et al., 2016) (A), additional SNPs identified by fine mapping using GBS method in PR-19 (B). Locations of QTLs for AB are shown by vertical bars. S13, S14, and R14 associated with QTLs name denote 2013 Saskatoon, 2014 Saskatoon, and 2014 Rosthern, respectively.
