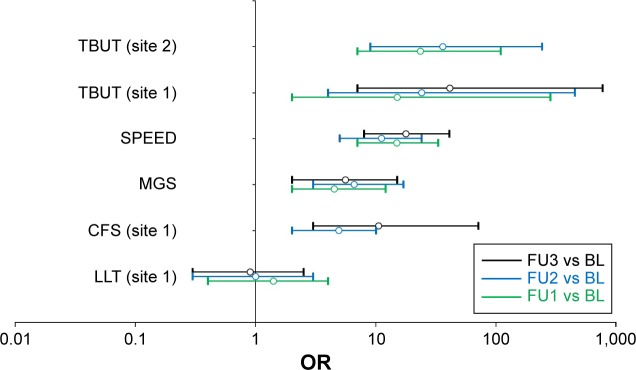
Figure 3.
Forest plot of odds ratios for study measures.
Notes: Outcome measures were dichotomized as detailed in Table 3. Open circles and bars represent ORs and 95% confidence intervals, respectively. Green, blue, and black symbols show FU1 vs BL, FU2 vs BL, and FU3 vs BL, respectively. ORs for which the 95% confidence interval do not cross OR =1 are statistically significant. Undefined ORs are missing from this plot.
Abbreviations: BL, baseline; CFS, corneal fluorescein staining; FU, follow-up; LLT, lipid layer thickness; MGS, meibomian gland score; ORs, odds ratios; SPEED, Standard Patient Evaluation of Eye Dryness; TBUT, tear breakup time.

