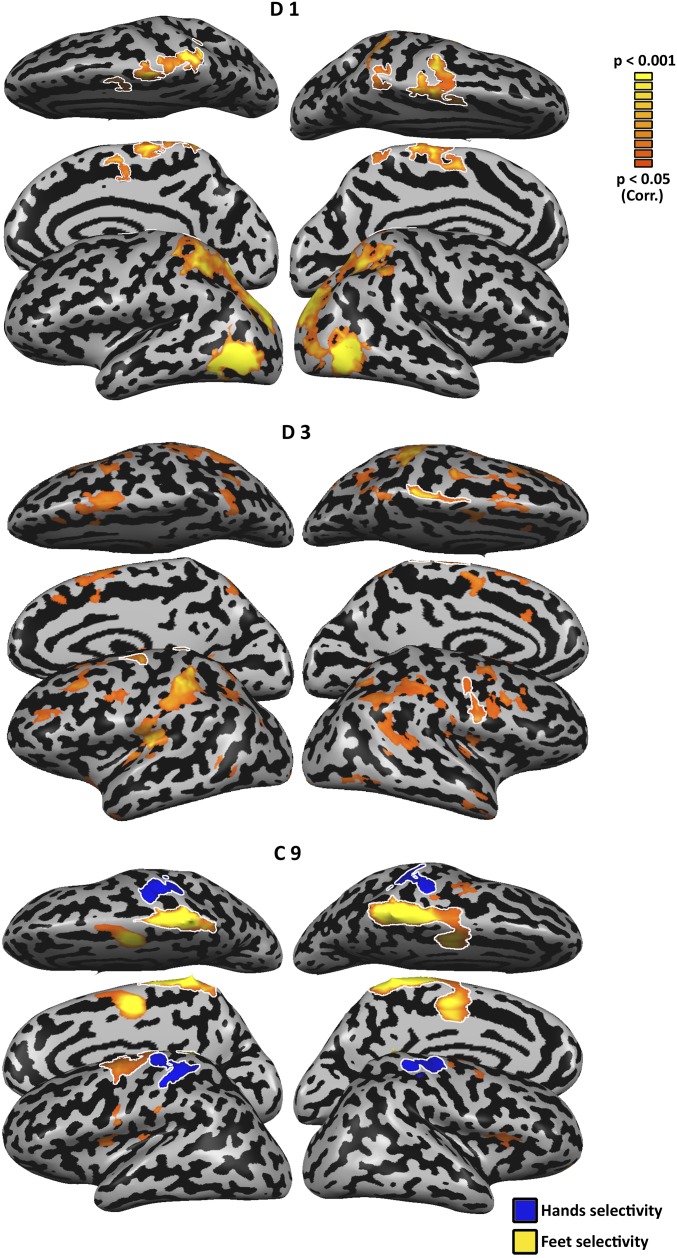
Fig. S3.
Motor responses in single subjects presented in Fig. 2. Motor foot selectivity (flexing the feet > flexing shoulders, stomach and mouth muscles; P < 0.05, corrected; depicted in orange) is presented for dysplasics D1 and D3, and control C9. The responses near the central sulcus are outlined and were used in Fig. 2 to identify the individual foot-selective regions. For subject C9, hand selectivity (flexing the hands > flexing shoulders, stomach and mouth muscles; P < 0.05, corrected; depicted in blue) is also presented.

