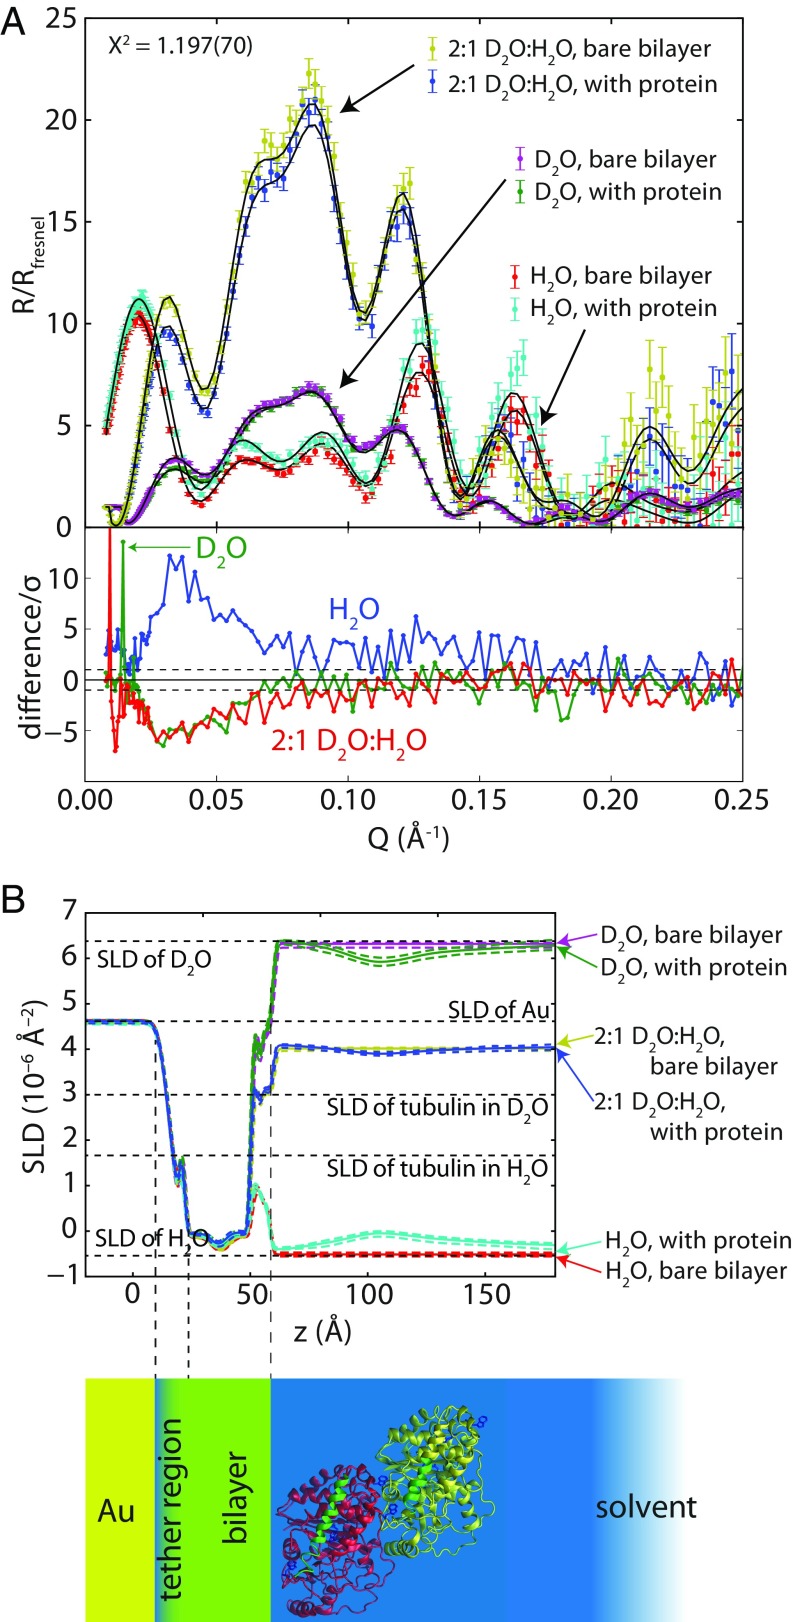
Fig. 5.
Results of NR experiment obtained on 1:1 DOPC:DOPE stBLM in the presence of 600 nM tubulin. (A) Neutron reflectivity spectra. R is the ratio between the reflected and incident neutron intensities, and Rfresnel is the Fresnel reflectivity expected from the buffer/silicon interface. The χ2 value for the simultaneous fit of all six spectra to the model described in the text was 1.197 ± 0.070. Lower panel shows the difference in the NR spectra after adding protein, normalized to the experimental error at each point. (B) SLD profiles determined from optimizing the tubulin orientation model to the reflectivity profiles, showing the correspondence of the profile to the layered structure of the stBLM; 95% CI on the SLD profiles are shown as dashed envelopes.

