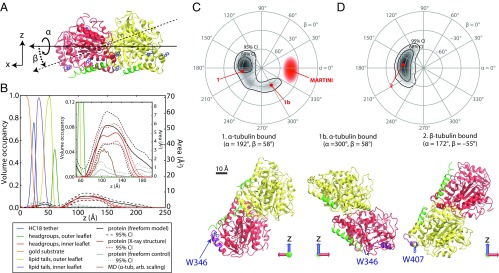
Fig. 6.
Determination of the orientation of bound tubulin by NR. In structures, α-tubulin is colored red, β-tubulin is yellow, the C termini of each chain are green, highlighted tryptophan residues are blue, and the putative binding regions are purple. (A) Euler angles used in orientation parameterizations according to an extrinsic x–y–z scheme, where z is the membrane normal. (B) Structure of the bilayer/protein system determined from fitting a composition model to the NR spectra. (Inset) Expanded view of protein region, showing comparison between free-form model, tubulin model using X-ray crystallographic structure (with a free-form control to reduce systematic error), and the coarse-grained MD simulation of α-tubulin. Dashed lines indicate 95% CIs on the protein density profiles. (C and D) Polar orientation plot of geometries consistent with NR data. Contours bound the 68% and 95% confidence regions. For β > 0°, α-tubulin is bound to the lipid surface (C); β-tubulin is bound for β < 0° (D). Selected orientations of bound tubulin are shown below the polar orientation plots. Orientations 1 and 2 are the orientations corresponding to the mean rotation angles, and orientation 1b most closely resembles the MARTINI orientation of α-tubulin (discussed in the text). Note that the identification of the binding surface does not change significantly with α rotations.

