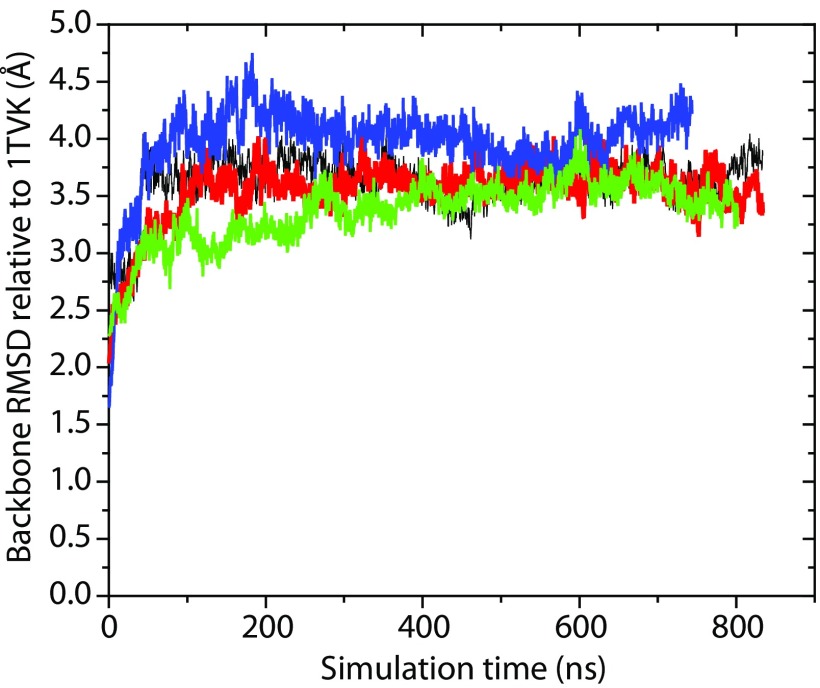
Fig. S1.
RMSD for backbone atoms (relative to 1TVK coordinates) from ANTON production of all-atom MD simulations for α-tubulin and β-tubulin monomers starting from membrane-attached states. RMSD values for α-tubulin with DOPE and DOPC bilayers are shown in black and red solid lines, respectively. RMSD values for β-tubulin with DOPE and DOPC bilayers are shown in green and blue solid lines, respectively.

