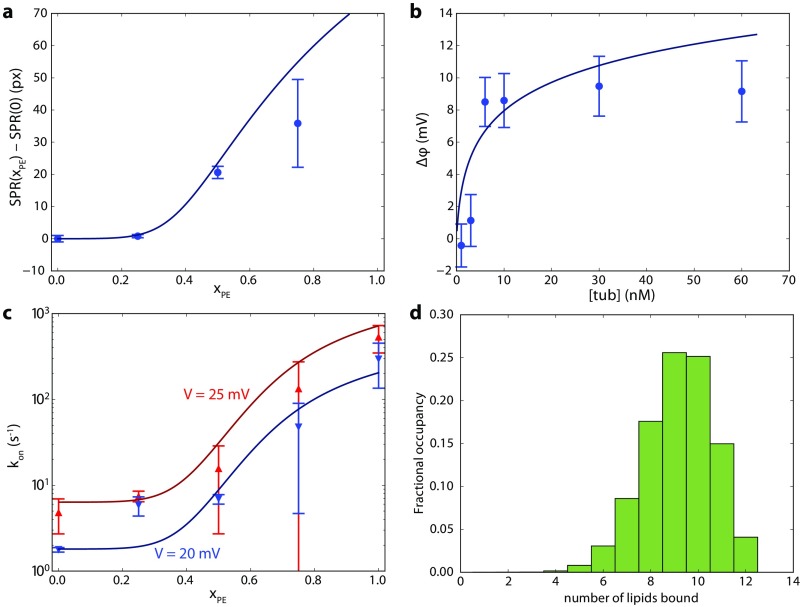
Fig. S8.
Determination of tubulin–DOPE dissociation constant and the maximum number of DOPE molecules that can be bound to each tubulin dimer , using the methods in Mosior and McLaughlin (47). Briefly, the mass balance equations for tubulin and lipid were numerically solved for the concentrations of unbound lipid, unbound protein, and all protein–lipid complexes in which lipids are bound. Solid lines represent best-fit curves to experimental data, using and . Other free parameters include the maximum SPR response, maximum BOA response, the maximum and minimum VDAC interaction rates, and a fixed ratio between the interaction rates at the two voltages, and the volume/area ratio for the BOA and single-channel measurements. The volume/area ratio for the SPR measurements is fixed by the experimental geometry. (A) Difference in tubulin binding measured by SPR to binary DOPC/DOPE membranes with PE fraction relative to , showing clear positive cooperativity. Error bars are mean ± one SD from the mean for two experiments per lipid composition. (B) Tubulin binding measured by BOA (reproduced from Fig. 4). (C) On rate of the tubulin/VDAC interaction (data from ref. 13) in binary DOPC/DOPE membranes at 20 mV and 25 mV transmembrane potential, showing similar positive cooperativity. (D) Distribution of bound species in the dilute limit at equilibrium, using best fit parameters. Average occupancy is nine bound PE lipids.

