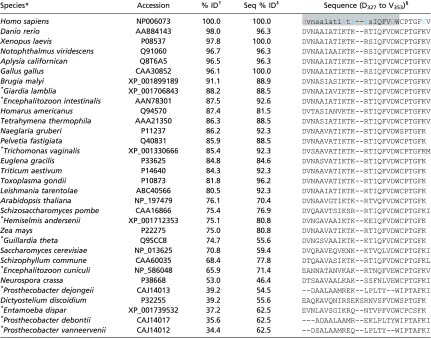
Table S2.
Putative α-tubulin binding region surrounding H10 (A330 to W346) shows broad conservation across species, particularly W346
 |
Species marked with an asterisk do not contain mitochondria.
Species are sorted by α-tubulin similarity to H. sapiens, expressed as percent identity (% ID).
The percent identity of the binding region is shown as Seq % ID. The correlation coefficient between % ID and Seq % ID is 0.84.
In the H. sapiens structure, lowercase residues denote a sequence considered a low-complexity region by the BLASTP alignment algorithm (79). Red represents anionic and blue cationic residues, and the gray region is helix H10.
