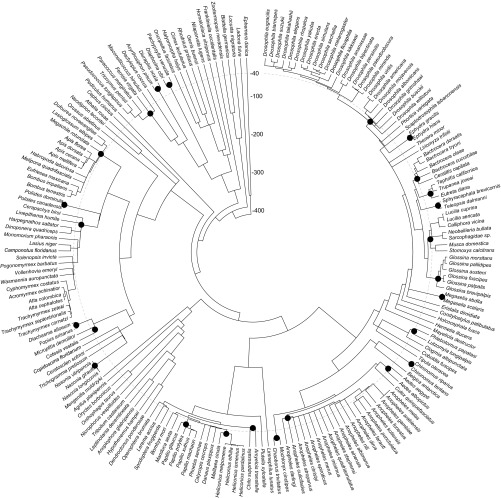
Fig. S1.
Time tree of the 195 insect species used in this study. Divergence times are taken from Misof et al. (23) and other references collected by timetree.org/. Times are shown in My from present. Black dots represent the most recent common ancestors of species that were collapsed into lineages within which homology at TEs was ignored, due to insufficient synonymous genetic divergence (dS) at core genes or because these species diverged in the last 40 My (dashed line).

