Fig. S4.
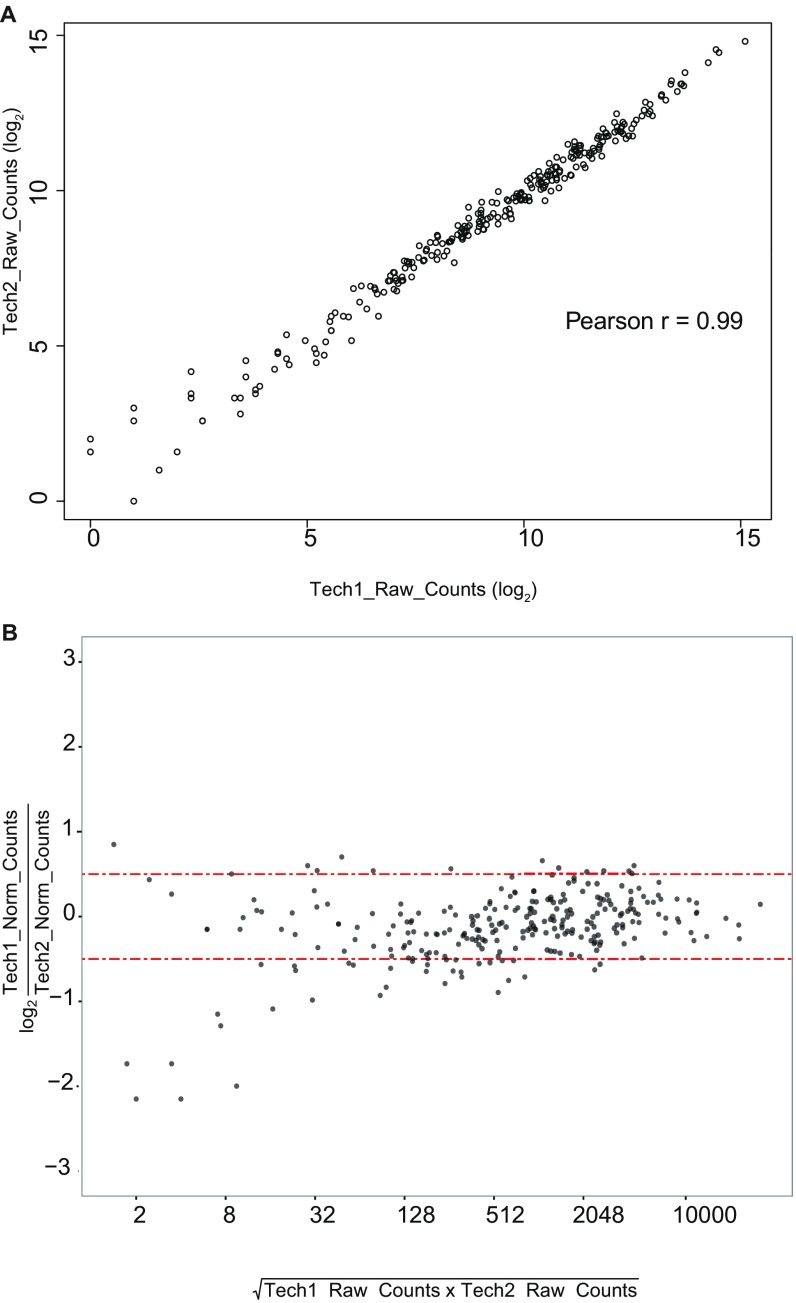
Lariat sequencing datasets are highly reproducible. (A) Raw counts for the 276 annotated introns used in the analysis in Fig. 5A (SI Materials and Methods) for two technical replicates of prp8 N1869D are plotted as an XY scatter. (B) MA plot of the same data depicted in A. The y axis uses raw counts normalized to total raw counts from all annotated introns. Red lines mark changes ±0.5 (log2) between the replicates.

