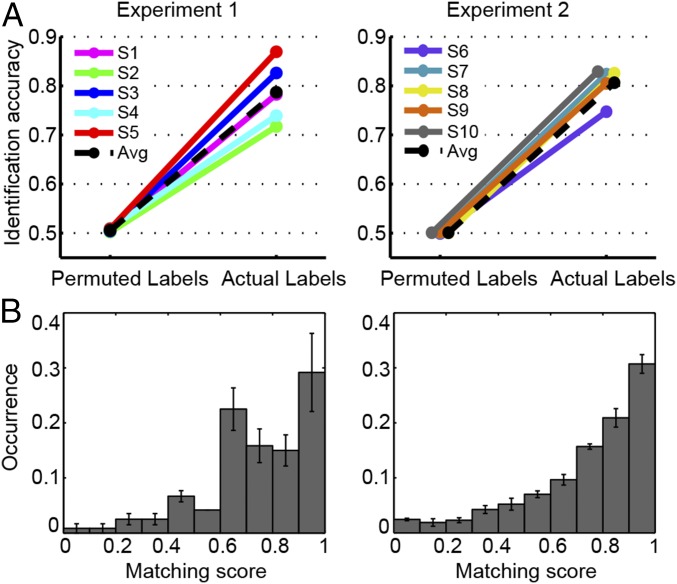
Fig. 2.
Identification results. (A) Identification accuracy for individual participants. Each panel shows the accuracy obtained with correct labels and the accuracy derived by permuting the sound labels. (B) Average distribution of matching scores across subjects for the modulation-based reconstruction (mean ± SEM, n = 5, for the two experiments separately). These matching scores are used to calculate the identification accuracy. Avg, average.

