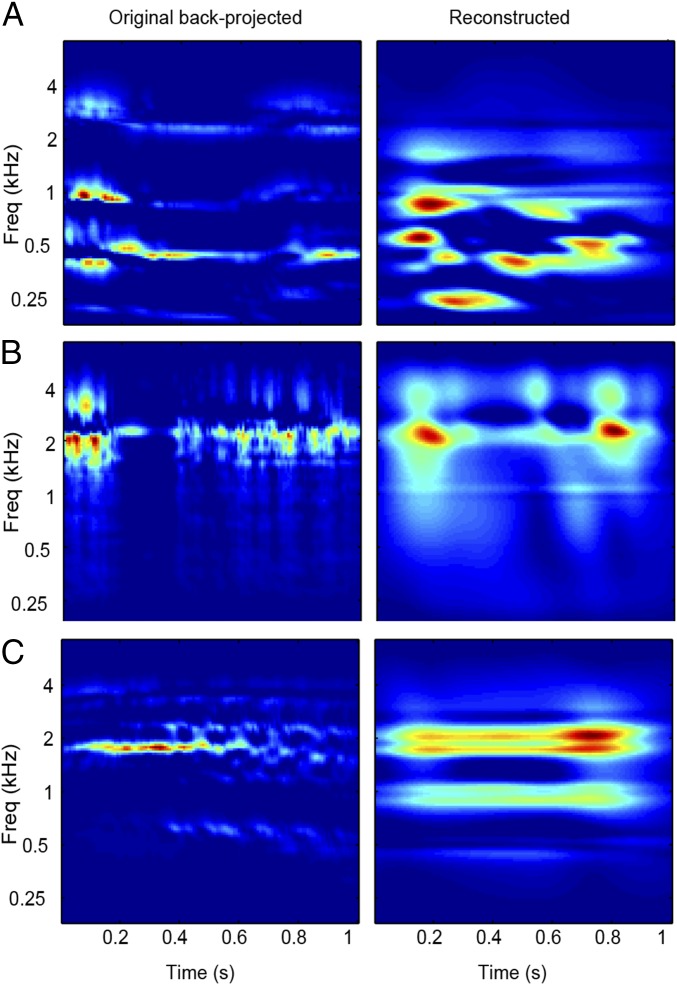
Fig. 3.
Examples of reconstructed spectrograms. Reconstructed spectrograms for vocal (A), tool (B), and animal (C) sounds. The original spectrograms are depicted in Fig. 1. (Left) Reference spectrograms obtained by inverting the down-sampled (10 time bins) magnitude-only modulation representation of the original sounds (SI Materials and Methods). (Right) Sound spectrogram as reconstructed from the fMRI-based predictions (also Movies S1–S3).

