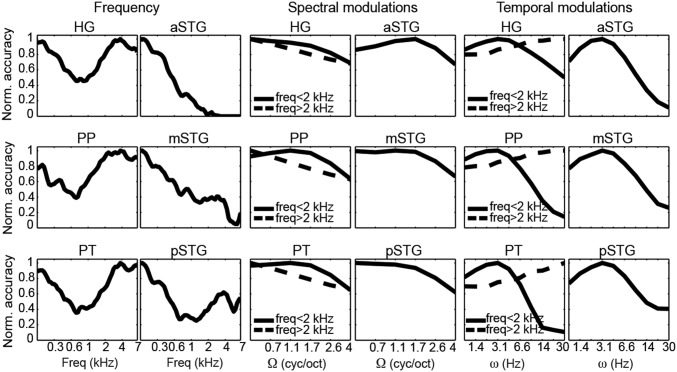
Fig. 5.
ROI-based marginal profiles for frequency, spectral modulation, and temporal modulation. Each profile was obtained by averaging the MTFs along the other two dimensions and normalized (Norm.) by its maximum value. Based on the visual inspection of the full MTF (Fig. 4B) for the HG, PP, and PT, we computed distinct marginal tuning functions for frequencies below and above <2 kHz.

