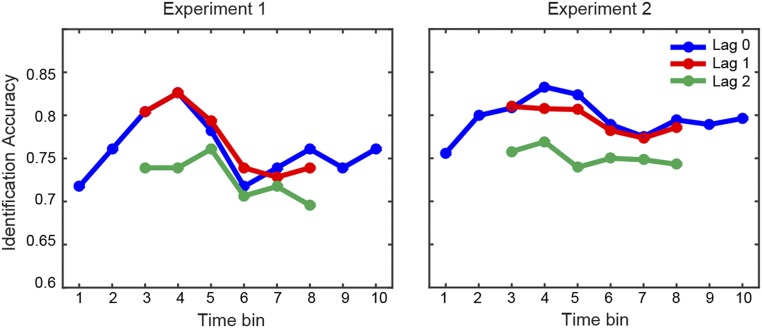
Fig. S2.
Temporal specificity of modulation-based reconstructions. Identification accuracy (median across subjects), as obtained for each separate time window in experiment 1 (Left) and experiment 2 (Right), is shown. The blue, red, and green lines indicate, respectively, the identification accuracy calculated using actual sound features for time bin i and fMRI-based predictions for time bin i (lag = 0, blue), i ± 1 (lag = 1, red), and i ± 2 (lag = 2, green) bins. Identification accuracy was significantly above chance for each time window in both datasets (P < 0.05, group-level one-tailed Wilcoxon signed-rank test), with a trend toward larger values for the central time bins. The identification accuracy for lag = 0 predictions did not differ significantly from the identification accuracy for lag = 1 predictions, but was significantly higher than the identification accuracy for lag = 2 predictions (experiment 1: P = 0.02, experiment 2: P < 0.0001, random effects group analysis, Friedman test with lag and subject as factors). Each time bin corresponds to 100 ms.

